

Before you begin
- The board must already be configured with Plans (columns) and swimlanes (rows). See Configure Plans (Columns) and Configure Swimlanes (Rows).
- Capacity tracking works with time-based effort fields (
remainingEstimate,initialEstimate) or a custom numeric field on work items. Decide which approach your team uses before proceeding.
1
Enable capacity load visualization
Open the widget parameters for your Planningboard widget.Under Parameters for Plans (Columns), locate the Show Capacity Load toggle and enable it. This activates the Once enabled, a capacity bar appears at the top of each Plan column, showing the aggregate planned effort versus capacity for that Plan.
capacityLoad property, which defaults to false.2
Choose a capacity field
By default, Planningboard reads effort from Polarion’s built-in time-tracking fields (Leave
remainingEstimate and initialEstimate). If your team uses a custom numeric field instead (for example, story points stored in a custom field), set the capacityField property to that field’s ID.capacityField empty to use the default time-based fields.3
Set hours per day (time-based capacity only)
If you are using time-based effort fields, Planningboard converts effort values using the Adjust this value to match your team’s working day (for example,
hoursPerDay property. The default is 8 hours per day.6 for a 6-hour working day). This affects how the capacity bar computes load when effort is stored in hours.4
Decide between single and multi-dimensional capacity
Planningboard supports two capacity modes:
These modes build on each other —
multiCapacityLoad requires capacityLoad = true to take effect:User-level capacity requires Teams service
userCapacityLoad = true depends on the Teams service integration (useTeamsService = true). Without the Teams service configured, this property has no effect. See Set Up Teams Service and Track User Capacity.5
(Optional) Enable Teams service for plan-level capacity
If your project uses the Polarion Teams service, enable it to supply accurate per-team and per-user capacity values that override the default plan capacity:
selectedTeam filters the board to a specific team ID. Leave it empty to show all teams.6
Verify in the board
After saving the widget parameters, open or refresh the Planningboard. You should now see: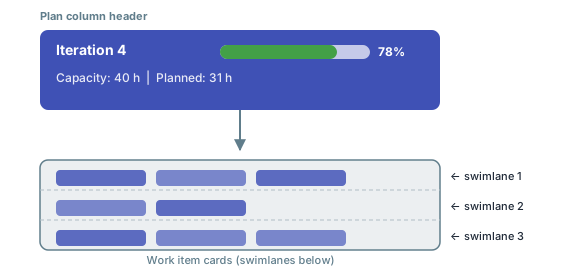
- A capacity bar at the top of each Plan column (if
capacityLoad = true). - The bar fills proportionally as work items are planned into the column.
- Hovering over a capacity bar shows a tooltip with detailed capacity information: total planned effort, available capacity, and the load percentage.
Known limitations
- No multi-assignee effort distribution. When a work item has multiple assignees, Planningboard does not split the effort across them — the full effort is attributed to the primary resource. This differs from Nextedy GANTT’s behavior.
- No sub-item effort roll-up. Effort from child work items is not automatically aggregated into parent items for capacity calculation purposes.
- Swimlane sort order is coupled to item sort order. Sorting items affects swimlane display order; these cannot be independently configured.