

Before you start
Open the widget parameters editor for your Nextedy PLANNINGBOARD widget. In Polarion, edit the LiveDoc or Wiki page containing the widget, then click the widget’s parameter icon to open the Parameters for Plans (Columns) section.1
Choose a Plans type
The Plans Type parameter (
plansMode) determines which type of Plans are loaded as columns. Select the value that matches your project setup:Configuration fields change by Plans TypeThe Plan items section (Scope, Query, Type) and the Sync to parent option are only available when Project Plans (
PROJECT_PLANS) is selected. These sections are hidden for SAFe modes because Plans are auto-discovered from the SAFe structure.2
Define which Plans appear (Project Plans mode)
When using Project Plans mode (To show Plans matching a custom field value:
PROJECT_PLANS), use the Plans field (plansQuery) to specify a Lucene query that filters which Plans appear as columns.Leave the field empty to load Plans automatically, or enter a query to restrict the set. Example: to show only Plans of a specific type:3
Set the planning window (last and next plan counts)
Two parameters control how many Plans are displayed: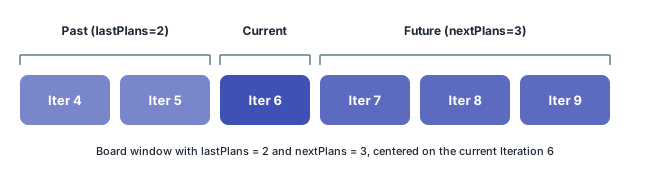
- Show # of last plans (
lastPlans, default1) — how many completed or past Plans to include to the left of the current Plan. - Show # of next plans (
nextPlans, default5) — how many upcoming Plans to include to the right.
lastPlans = 2 and nextPlans = 3 will see Iterations 4, 5, 6, 7, 8, and 9 on the board.4
Enable capacity load visualization
Turn on the Show Capacity Load toggle (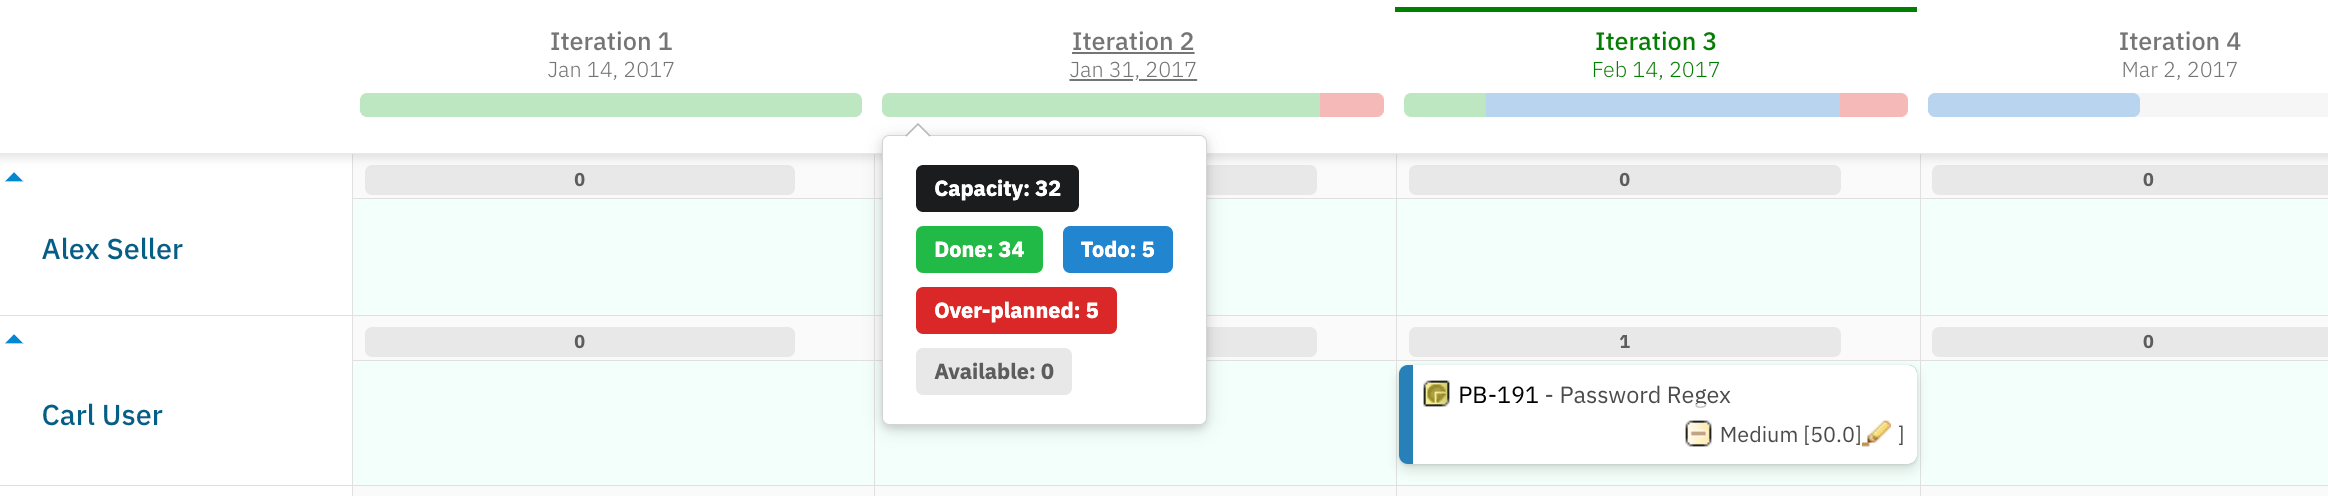
capacityLoad, default false) to display a capacity bar at the top of each Plan column. The capacity bar shows how much of the swimlane’s capacity has been consumed by planned work items.When enabled, hovering over a Plan column’s capacity bar opens a tooltip with a detailed capacity breakdown per swimlane.5
(Optional) Assign work items to the parent Plan automatically
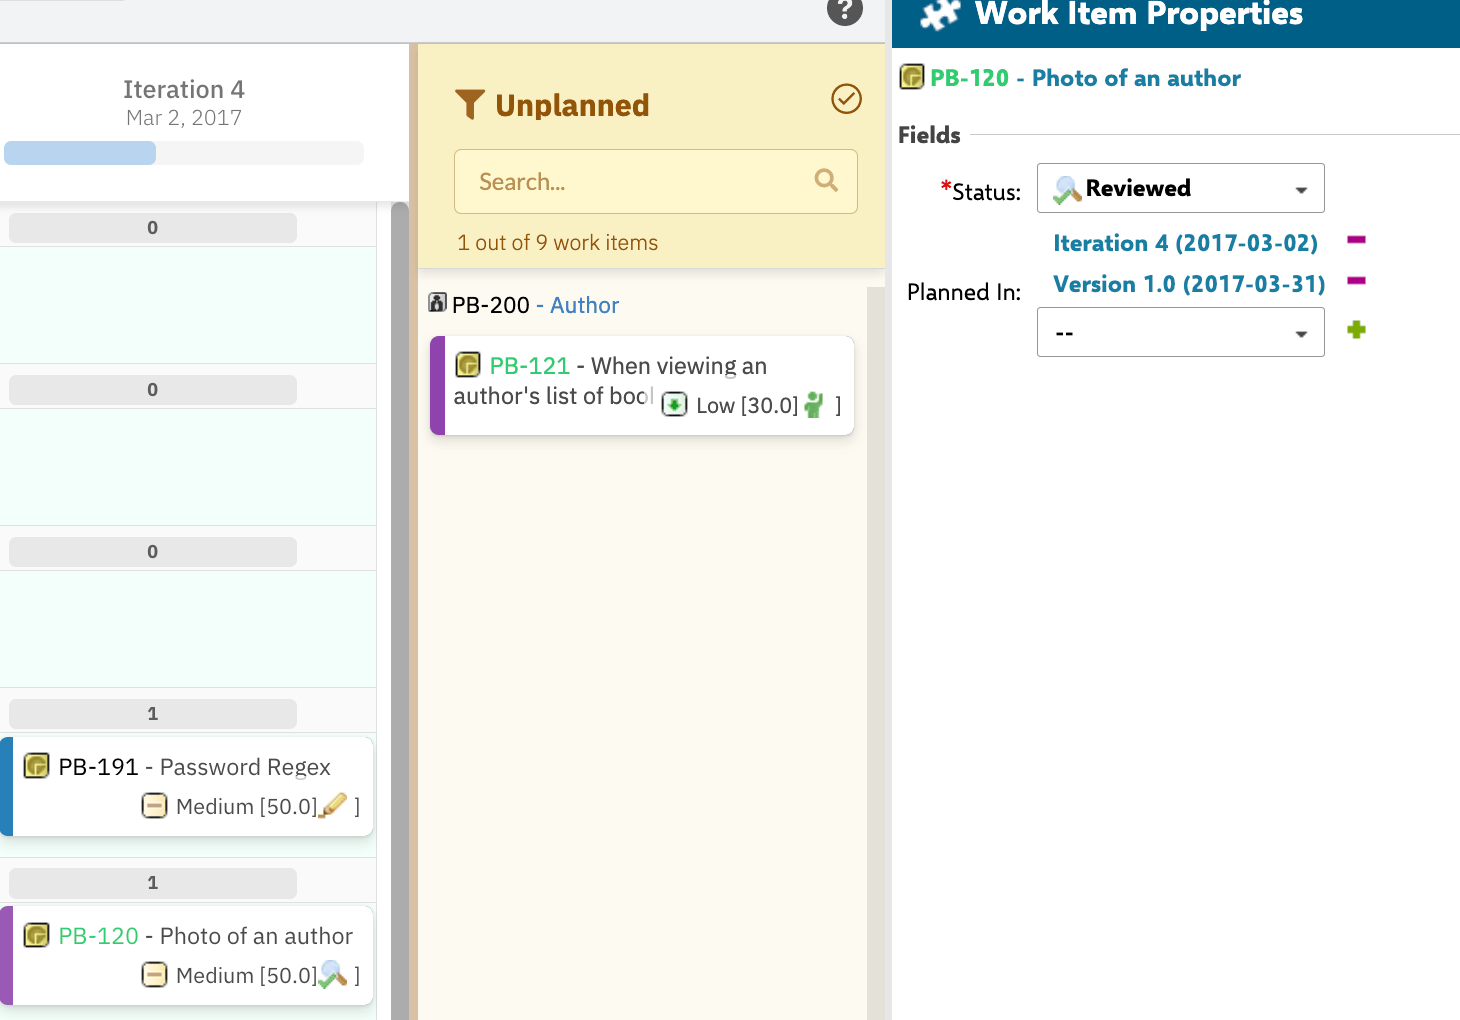
The Assign to Parent Plan toggle controls whether a work item dropped onto a Plan column is also automatically planned into that Plan’s parent Plan.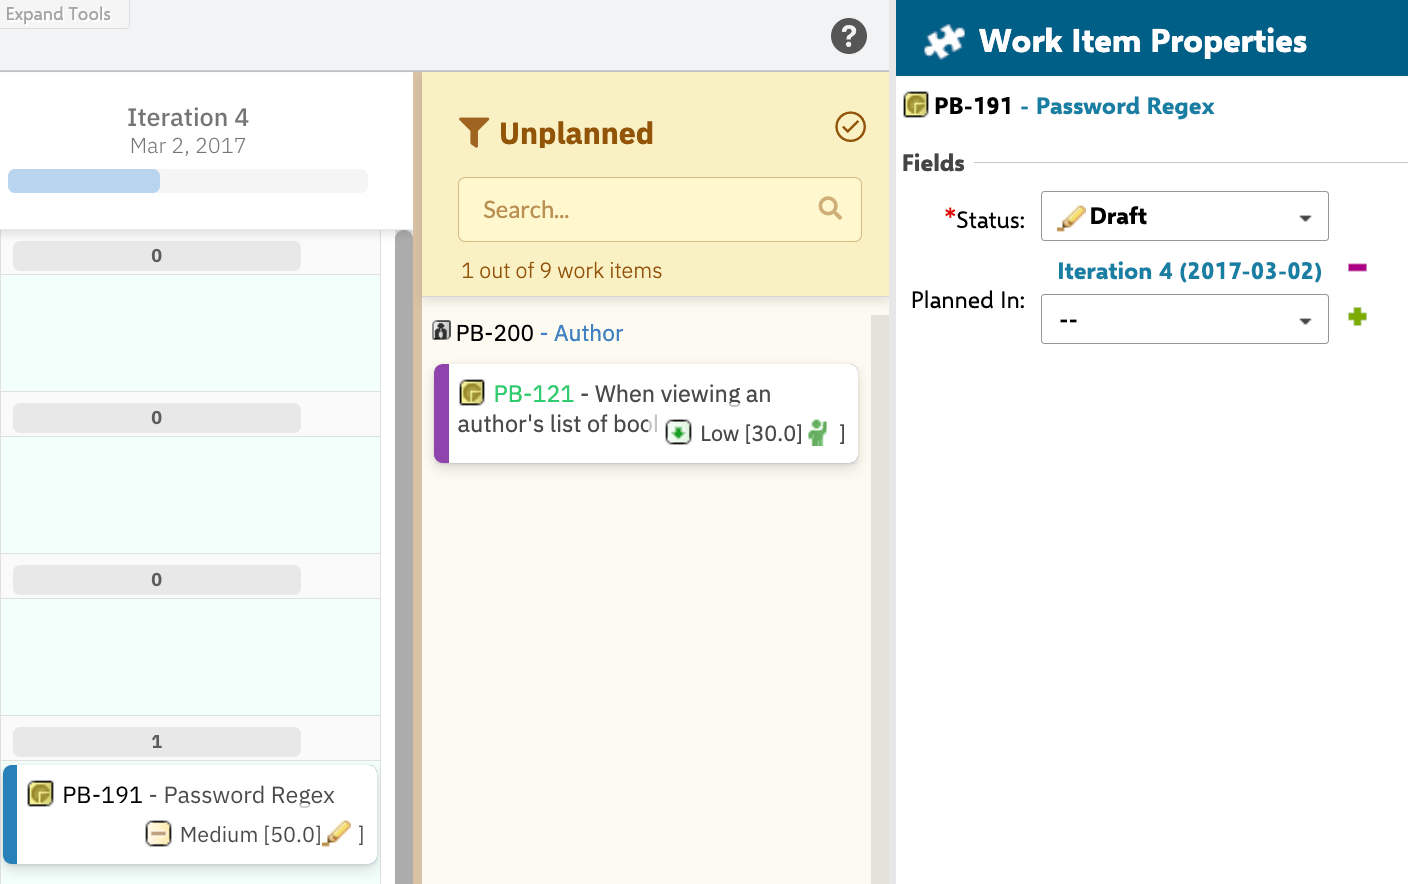
- Disabled (default): The work item is planned only in the target Plan (e.g., Iteration 4).
- Enabled: The work item is planned in both the target Plan and its parent Plan (e.g., Iteration 4 and Version 1.0).
6
(Optional) Add a report link on Plan column headers
The Report Link field (
planLink, default: /polarion/#/project/${plan.objectId.projectId}/plan?id=${plan.objectId.itemId}) defines a URL that opens when a user clicks a Plan column label. The URL supports template variables resolved per Plan:Example — link to a custom Wiki report parameterized by Plan:
Configuration example
The following shows a complete Plans (Columns) configuration for a Scrum team using standard Polarion iterations, displaying one past iteration and four upcoming ones, with capacity load enabled:Verification
After saving the widget parameters, reload the board. You should now see:- Plan columns matching your query and count settings, ordered chronologically from past (left) to future (right).
- Capacity bars visible at the top of each column if Show Capacity Load is enabled.
- Clicking a Plan column header navigates to the configured report link (or the Plan detail page if using the default).
See also
- Widget Parameters Overview — full widget parameter reference
- Configure Swimlanes (Rows) — configure how work items are grouped into rows
- Configure Capacity Tracking — set up capacity fields, hours per day, and normalization
- Configure Work Items Dataset — control which work items appear on the board
- SAFe Planning Workflows — end-to-end SAFe configuration guidance