

The mental model: filling buckets
Think of each swimlane as a bucket. A sprint’s capacity represents how full that bucket can get. Work items added to the swimlane pour effort into the bucket. The capacity bar — the progress indicator visible at the top of each plan column within a swimlane — shows how full the bucket is relative to its total size.
How capacity is calculated
Planningboard derives capacity from two sources, depending on how the board is configured.From the Teams Service
WhenuseTeamsService is enabled, Planningboard integrates with the Nextedy Teams Service to obtain per-user capacity per sprint. The Teams Service computes available hours based on the user’s calendar and their percentage assignment to the project. This means a user on part-time allocation or away during part of a sprint automatically has reduced capacity for that sprint — the capacity bar reflects their actual availability, not a fixed number.
This is the most accurate mode. It requires the Teams Service to be configured and running for the project. See Teams Service for setup details.
From a fixed Capacity value
Without the Teams Service, capacity is estimated using thecapacity property on a Plan level. It can hold capacity either in time-based or custom field-based formats.
Effort tracking: what counts as work
Planningboard measures the “water in the bucket” — the effort committed — in one of two ways:- Time-based: Uses
remainingEstimateandinitialEstimatefields from Polarion work items. Planningboard sums these across items in a swimlane-column cell to arrive at total effort, then converts to hours usinghoursPerDay. - Custom field: When
capacityFieldis set to a field ID, Planningboard reads effort from that field (for example, a story-points field) instead of time estimates.
effortDone with effortTodo set to zero.
Capacity modes
Planningboard offers three capacity modes, controlled by widget parameters:
Single capacity (
capacityLoad) is the simplest mode. One capacity bar appears per plan column, showing total effort committed in that sprint across all swimlanes combined. Use this for a quick column-wide load signal when swimlane-level granularity is not needed.
Multi-capacity (multiCapacityLoad) is the richer mode. Each swimlane-column cell gets its own capacity bar. This is what enables the “bucket per person per sprint” view described above — you can see at a glance which assignees are over capacity in which sprints. This mode requires each swimlane to carry its own capacity value, typically populated by the Teams Service.
User capacity (userCapacityLoad) works alongside the Teams Service to show capacity at the individual user level. This mode is most useful when swimlanes represent individual team members (the ASSIGNEE assignment mode).
The capacity tooltip
Hovering over a capacity bar on a Plan column reveals a capacity tooltip with detailed breakdown information. This tooltip is only available when capacity display has been configured via widget parameters.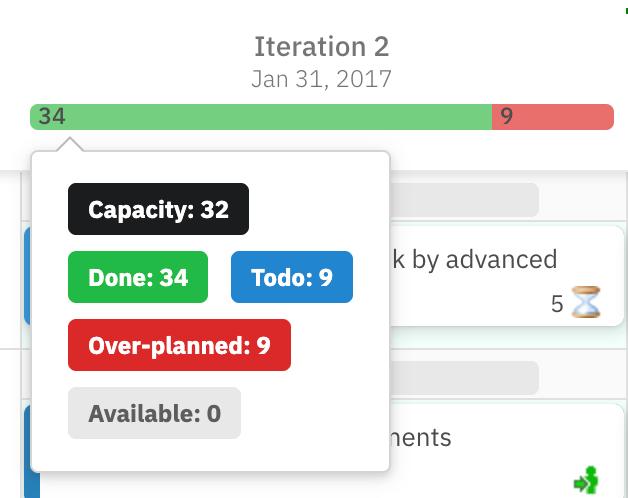
Toggling the resource load view
The toolbar’s Toggle Resource Load visualization button shows or hides the current load of each assignee in the swimlanes. This is a display toggle — it does not change how capacity is calculated, only whether the visualisation is shown on screen. This button is useful when you want to temporarily declutter the board view while still having capacity data available on demand.Known limitations
Planningboard’s capacity tracking covers the common single-assignee sprint planning case well, but has meaningful gaps compared to Nextedy GANTT’s capacity model. Be aware of these before relying on capacity data for critical planning decisions:No multi-assignee capacity distribution
Planningboard does not support work items with multiple assignees for capacity purposes. If a work item is assigned to more than one person, the capacity load is not split or distributed across those assignees. This is a confirmed gap versus GANTT’s capacity model. For teams where work items routinely carry multiple assignees, capacity figures in Planningboard will undercount actual load.No sub-item effort rollup
Planningboard calculates capacity from the effort fields on the work items directly visible on the board. It does not recurse into sub-items to roll up their effort. If your planning practice records effort on child tasks rather than on the parent feature or story, those child-item estimates will not appear in the capacity bar by default. However, with custom capacity calculations, it is possible to count sub-items instead of the actual planned items.Nextedy GANTT’s capacity model supports multi-assignee distribution and sub-item effort rollup. If your team relies on either of these patterns, evaluate whether GANTT’s capacity view better meets your needs for detailed capacity analysis, while using Planningboard for the board-style planning interaction.
Swimlane sort order coupling
The sort order of swimlanes affects item sort order on the board. This coupling means that adjusting swimlane ordering for visual reasons can inadvertently reorder work items within those lanes.How capacity varies sprint by sprint
A key insight of Teams Service–driven capacity is that the same user’s capacity bar is not constant across sprints. If Alice takes leave during Sprint 3, her bucket is smaller for that sprint — Planningboard reflects this by showing a lower total capacity for her Sprint 3 column. This makes it immediately visible that Sprint 3 has less room for Alice’s work, which should inform how items are distributed during planning. Without the Teams Service, Planningboard uses the fixedhoursPerDay multiplied by sprint duration, which produces the same capacity for every sprint for every user regardless of actual availability.

Relationship to swimlane assignment types
Capacity tracking only produces meaningful per-swimlane numbers when swimlanes represent identifiable resources — typically individual users (theASSIGNEE assignment mode) or teams. When swimlanes are grouped by a custom enumeration field or by parent work item, capacity bars reflect effort aggregated within that grouping, but there is no inherent “available capacity” for an enum value or a parent item in the same way there is for a person.
For capacity-driven sprint planning, the Users (Assignee) swimlane assignment type combined with multiCapacityLoad and userCapacityLoad is the recommended combination. See Swimlane Assignment Modes for a full explanation of how each assignment type structures the board.
Normalization and capacity together
Normalization is a related but distinct concept. Where capacity tracking shows how much work fits into a swimlane relative to a person’s availability, normalization adjusts how capacity is compared across swimlanes of different sizes (for example, swimlanes representing teams of different headcount). Read Normalization for a full explanation.Practical guidance
For planning teams setting up capacity tracking for the first time:- Start with
capacityLoad = trueand the fixedhoursPerDayto verify that effort data is flowing correctly from work items to the bars. - Once effort data looks correct, enable
multiCapacityLoad = trueif you need per-assignee visibility. - Connect the Teams Service and enable
userCapacityLoad = trueto get sprint-variable capacity that reflects real availability. - Set
capacityFieldonly if your team records effort in a custom field (such as story points) rather than Polarion’s standard time estimate fields.