Move around a Nextedy SCHEDULER board with the toolbar: zoom the day columns, scroll to today, collapse and expand swimlanes, switch the resource-load visualization on or off, and reload the data.
Everything you need to move around a Scheduler board sits in the toolbar above the timeline.
The controls change what you see — the zoom level, which rows are folded, which visualization is active — and never change your work items.The buttons are icon-only.
Hover one to see its label.
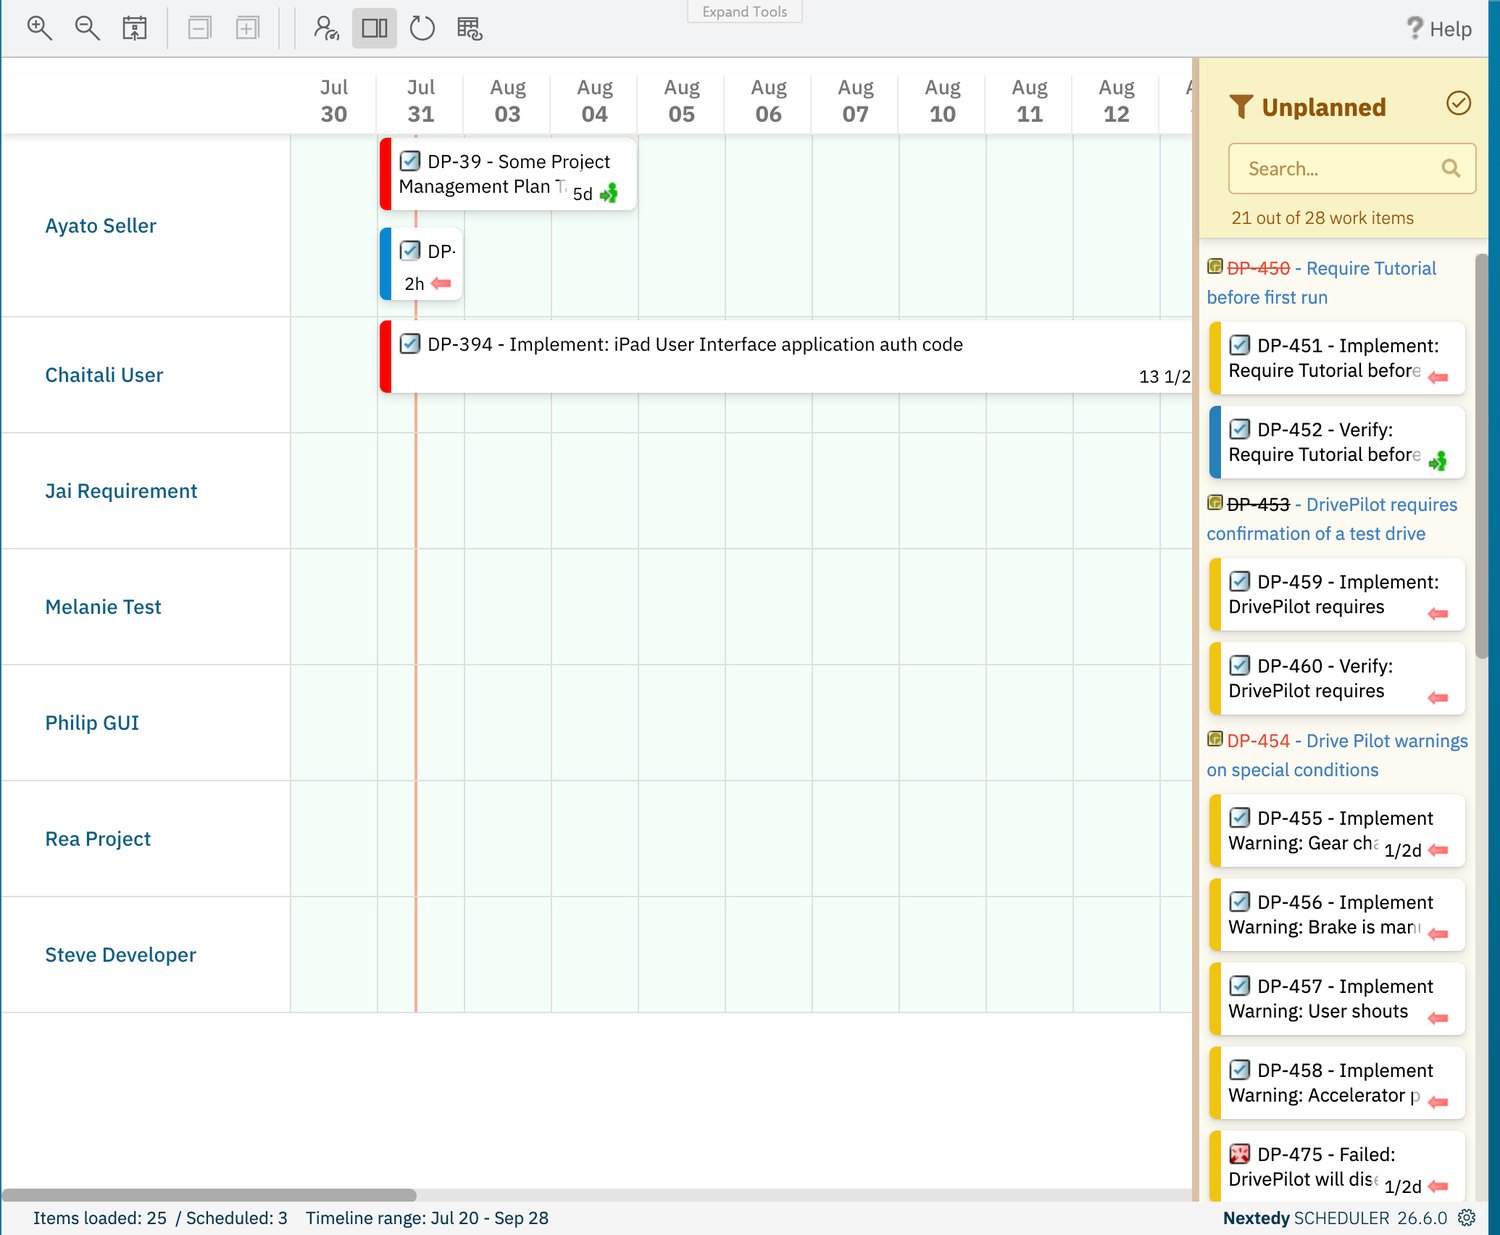
From left to right, the toolbar holds Zoom in the timeline, Zoom out the timeline, Scroll to today, Collapse rows, Expand rows, Toggle Resource Load visualization, Show unscheduled items in sidebar, Refresh data, and Show Dependencies, with a Help link at the far right.
Two of these are covered on their own pages: Show unscheduled items in sidebar in Filter the Unplanned Sidebar, and Show Dependencies in Link Task Dependencies.
Show Dependencies appears only when the widget has at least one Dependency Role configured.
There is no Save button.
The toolbar has no save control because the board saves every change as you make it.
See Schedule and Reschedule Tasks.
Click Zoom in the timeline to make the day columns wider, and Zoom out the timeline to make them narrower.Columns are 60 pixels wide when you first open a board, and each click changes the width by 30 pixels.
Zooming out stops at 30 pixels — once the columns are that narrow, further clicks leave the board unchanged.Wider columns give you room to read the task titles and the per-day load figures; narrower columns fit more of the window on screen at once.
Zoom does not change which dates the board covers.
The visible date range comes from the widget’s Days Back and Days Forward parameters, and zooming only changes how much of that range fits on screen.
To widen or narrow the range itself, see Advanced Configuration.
2
Scroll back to today
Click Scroll to today to bring today’s column back into view.
Today is marked on the grid by a red vertical line.This scrolls within the board’s date range rather than changing it, so it is the fastest way back after you have scrolled weeks ahead.
If the dependency overlay is currently drawn, Scroll to today clears it.
3
Collapse and expand the swimlanes
In the timeline view each swimlane is a group: a summary row for the resource, with a single child row underneath it that holds that resource’s task bars.
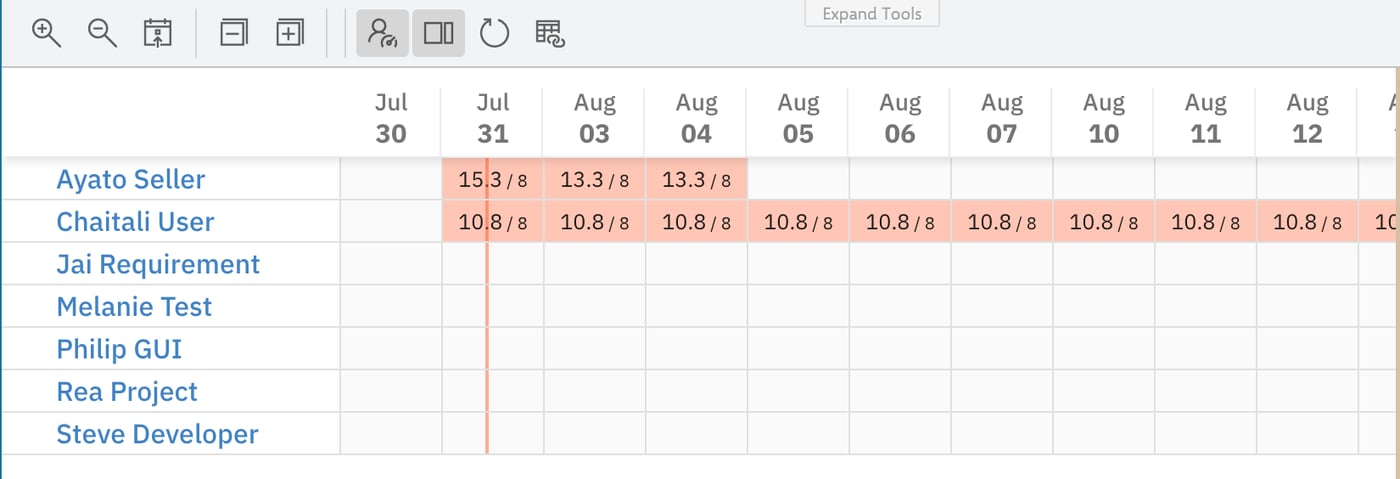
Collapse rows folds every swimlane down to its summary row. The per-day load markers stay visible, so you get a compact heat map of who is busy and who is overloaded, with no individual task bars in the way.
Expand rows opens all the swimlanes again and brings the task bars back.
Both buttons act on the whole board at once.
After Collapse rows: one line per resource, load markers only.
4
Switch the resource-load visualization on or off
A board opens with the resource-load visualization on: swimlanes are grouped rows and each day cell that carries load shows a marker in the form load / capacity.Click Toggle Resource Load visualization to switch it off.
The board becomes a flat list with one row per resource and the per-day load markers are removed, which is the least cluttered way to read the schedule itself.
Click the button again to switch the visualization back on.
Your scroll position is kept when you toggle, and any dependency overlay is cleared.
Collapse rows and Expand rows do not apply while the resource-load visualization is off.
The flat view has no grouped swimlanes to fold, so both buttons are greyed out until you switch the visualization back on.
For how the load figures are calculated and what the marker colours mean, see Capacity and Load.
5
Reload the board's data
Click Refresh data to reload the board’s work items in place, without reloading the whole Polarion page.Use it after you or someone else has changed dates, assignees, or estimates elsewhere in Polarion — for example after editing a work item in the Polarion sidebar that opens when you click a card.
The load markers and the footer counts recalculate from the reloaded data, and any dependency overlay is cleared.
Your view settings are stored in your own browser, per board, and are reapplied the next time you open the page:
Remembered
Effect when you come back
The active view
The board reopens in the timeline view or the flat view, whichever you left it in
The column width
The board reopens at the zoom level you left it at
The selected card
The card you last clicked is still selected
Because these are browser-side settings, they are yours alone — they do not change the board for anyone else, and a colleague opening the same page sees their own last state.
The footer under the timeline tells you what is currently loaded:
Items loaded: N / Scheduled: M — how many work items the board has loaded, and how many of them are placed on the timeline. Unscheduled items are listed under Unplanned when the sidebar is switched on.
Timeline range: <start> - <end> — the first and last date the board currently covers.
Every toolbar control and its exact label is listed in Toolbar Controls.
Open a page that holds a Scheduler board and work through the controls:
Click Zoom in the timeline twice. The day columns get wider each time.
Click Zoom out the timeline repeatedly. The columns narrow, then stop changing once they reach their narrowest step.
Scroll the timeline a few weeks forward, then click Scroll to today. Today’s column, marked by the red line, comes back into view.
Click Collapse rows. Every swimlane folds to its summary row and only the load markers remain. Click Expand rows to restore the task bars.
Click Toggle Resource Load visualization. The board switches to one flat row per resource, the load markers disappear, and Collapse rows and Expand rows are greyed out. Click the button again to switch back.
Click Refresh data. The board reloads and the footer counts are re-stated.
Reload the Polarion page. The board comes back in the view and at the zoom level you left it in.