

What the Board Is Made Of
The Scheduler board has four parts, and every question about the timeline comes back to one of them.
Below the grid, the footer reports what is currently loaded:
Items loaded: N / Scheduled: M, followed by Timeline range: and the first and last day of the window.
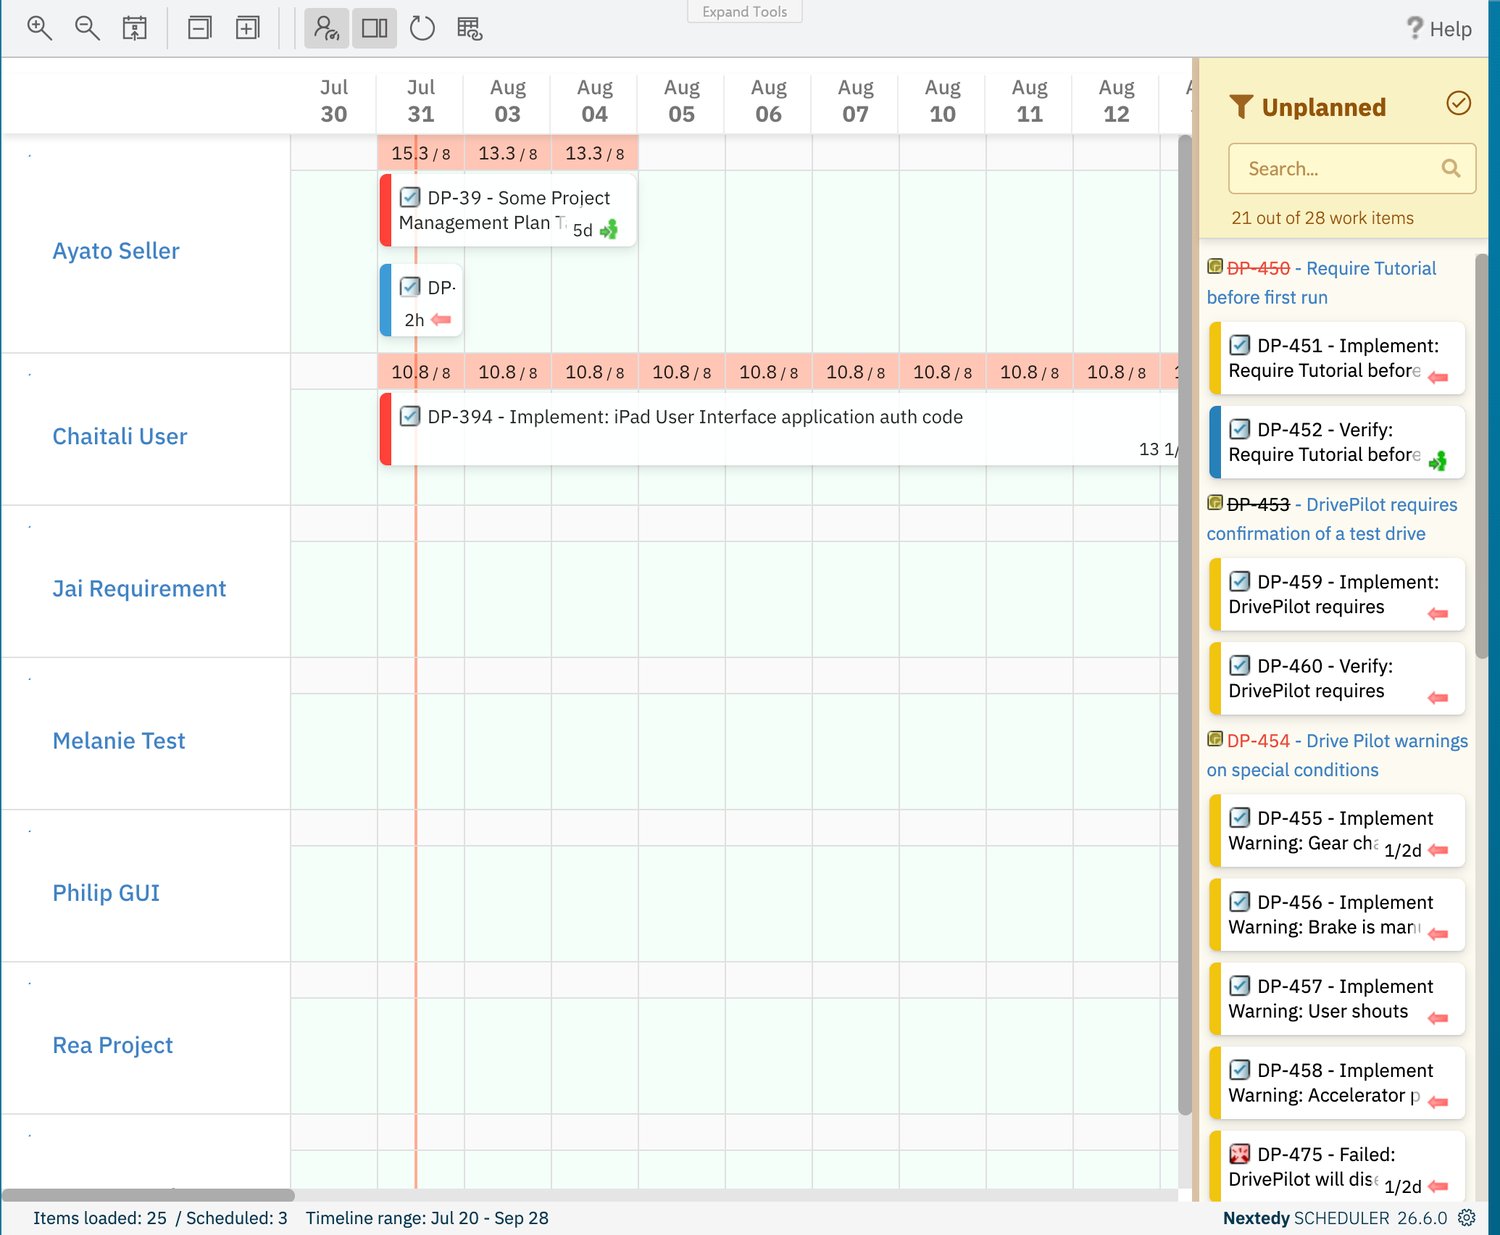
The four parts of the board: swimlane rows on the left, day columns across the top, task bars in the grid, and the Unplanned sidebar on the right — with the status footer underneath.
Two Views of the Same Data
The board renders in one of two layouts. The toolbar button Toggle Resource Load visualization switches between them, and it is active when you first open a board. The timeline view is what you land on. Each resource contributes two stacked rows: a summary row whose day cells carry the per-day load markers, and a child row underneath that holds the task bars. Because the summary row is a folder, the pair can be collapsed and expanded. The flat view appears when you turn Resource Load visualization off. Each resource becomes a single row of bars, the load markers are gone, and the row-folding controls no longer apply.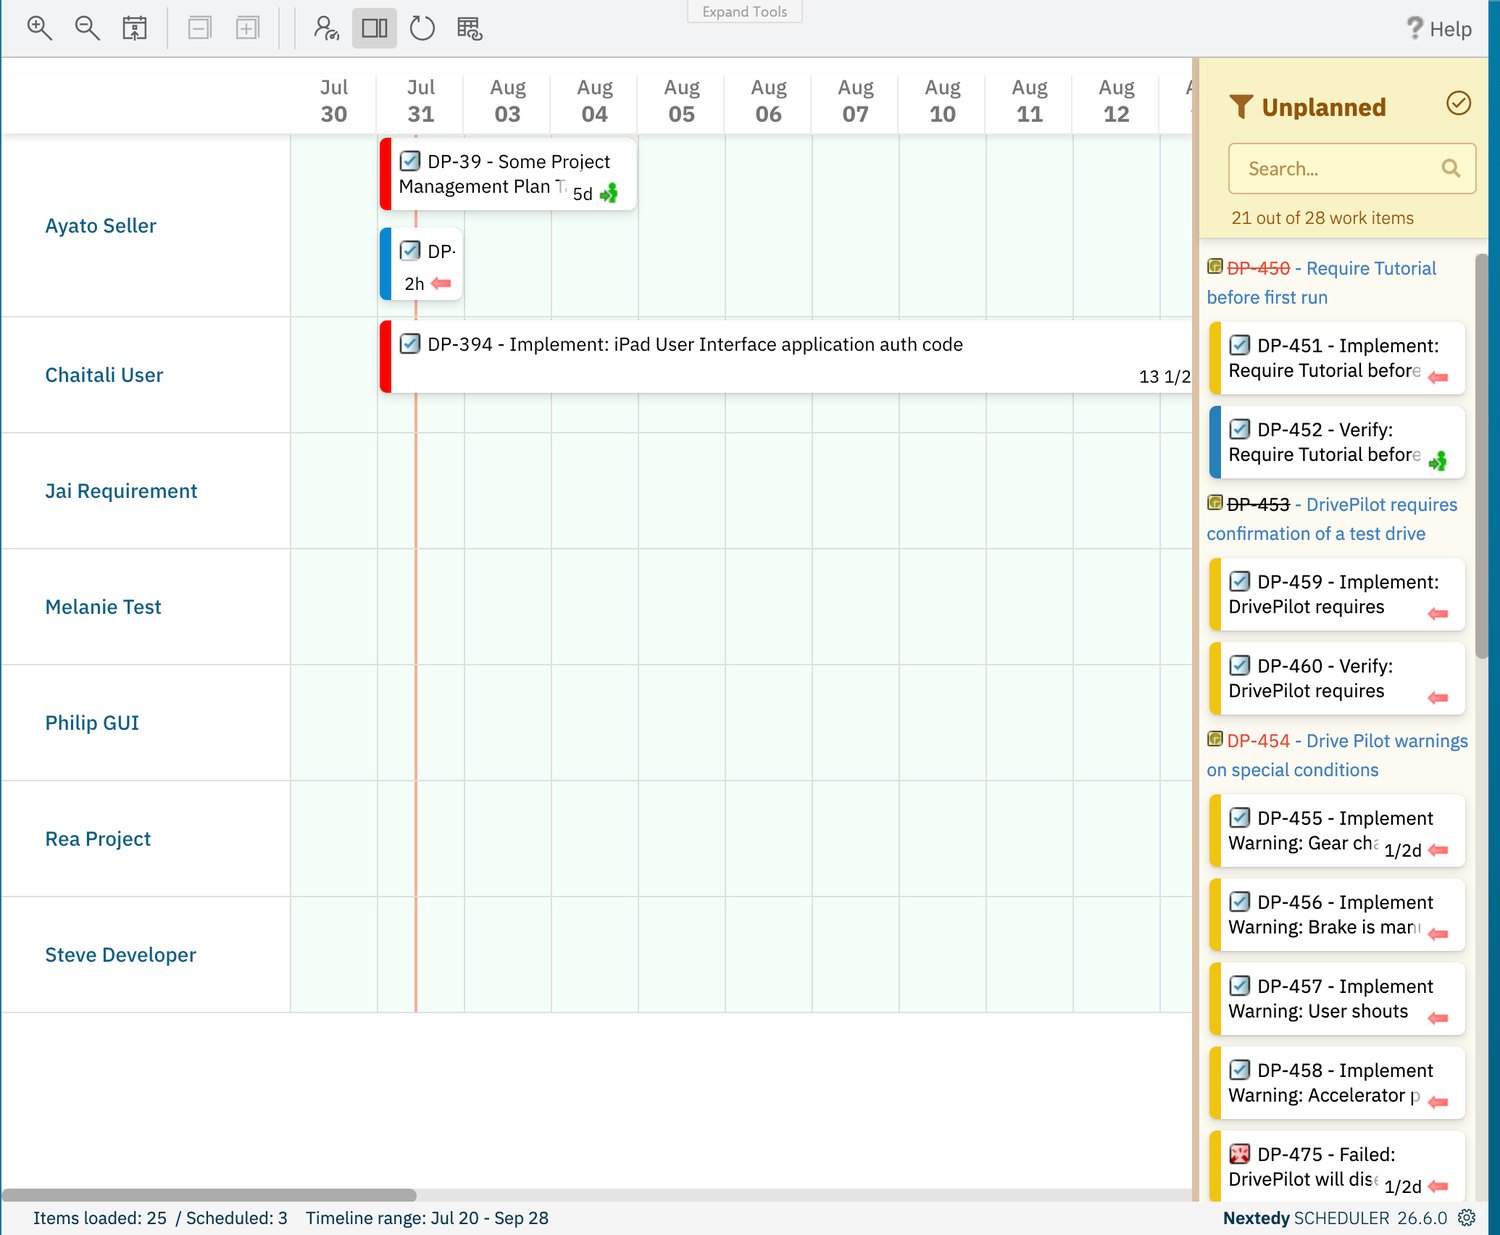
The flat view: one row per resource, no load markers, and Collapse rows / Expand rows greyed out in the toolbar.
Your choice of view is remembered in your browser, together with the column width, so re-opening the page brings back the layout you left. See Navigate the Timeline for the full set of view controls.
Day Columns and Zoom
The x-axis is always days — there is no week, month, or hour scale. Each column is 60 px wide by default, and the two zoom buttons change that width in steps of 30 px:- Zoom in the timeline widens the columns, so fewer days are on screen and bars are easier to read.
- Zoom out the timeline narrows the columns, so more of the window fits on screen.
Weekends and Non-Working Days
Weekends are hidden by default. The grid skips Saturday and Sunday entirely, so a Friday column is followed directly by the next Monday. The practical consequence is that the columns on screen are working days, not calendar days. Other non-working days are handled differently: a day that a row’s working calendar treats as non-working stays in the grid and is drawn with a diagonal hatch pattern. Hatched days carry no capacity, so they show no load figure.Because weekends are skipped and off-days are hatched, the horizontal distance between two bars is a count of working days, not elapsed days. Durations behave the same way — see Dates, Duration and Effort.
The Visible Window
The board never shows an unbounded timeline. It renders a window anchored on today, defined by two parameters in the widget’s Advanced panel:
So a board with Days Back
10 and Days Forward 60 shows the range from ten days ago to sixty days ahead. The footer’s Timeline range readout is the plain-language confirmation of that calculation: it prints the first and last day actually loaded.
Work items that the query returns but that carry no schedule are not drawn as bars at all. They wait in the Unplanned sidebar until you place them, which is what Schedule and Reschedule Tasks walks through.
Reloading and Saving
Refresh data re-reads the work items from Polarion and redraws the board in place, which is what you use after someone else has changed dates or effort. There is no Save control on the toolbar, and none is needed. Moving a bar, scheduling an item from the sidebar, or unplanning one writes straight back to the work item, so the board and Polarion stay in step without an explicit save step.See Also
- Swimlanes and Resources — where the rows come from and what capacity each kind of row carries
- Capacity and Load — how to read the per-day load markers on the summary rows
- Navigate the Timeline — zoom, scroll, collapse, and view switching in practice
- Toolbar Controls — every toolbar button with its exact label and effect
- Filter the Unplanned Sidebar — narrowing the backlog that feeds the board