


Data Model Levels vs Visual Levels
Before diving into thelevels array, it is essential to understand the distinction between the data model and the visual hierarchy that the levels array creates.
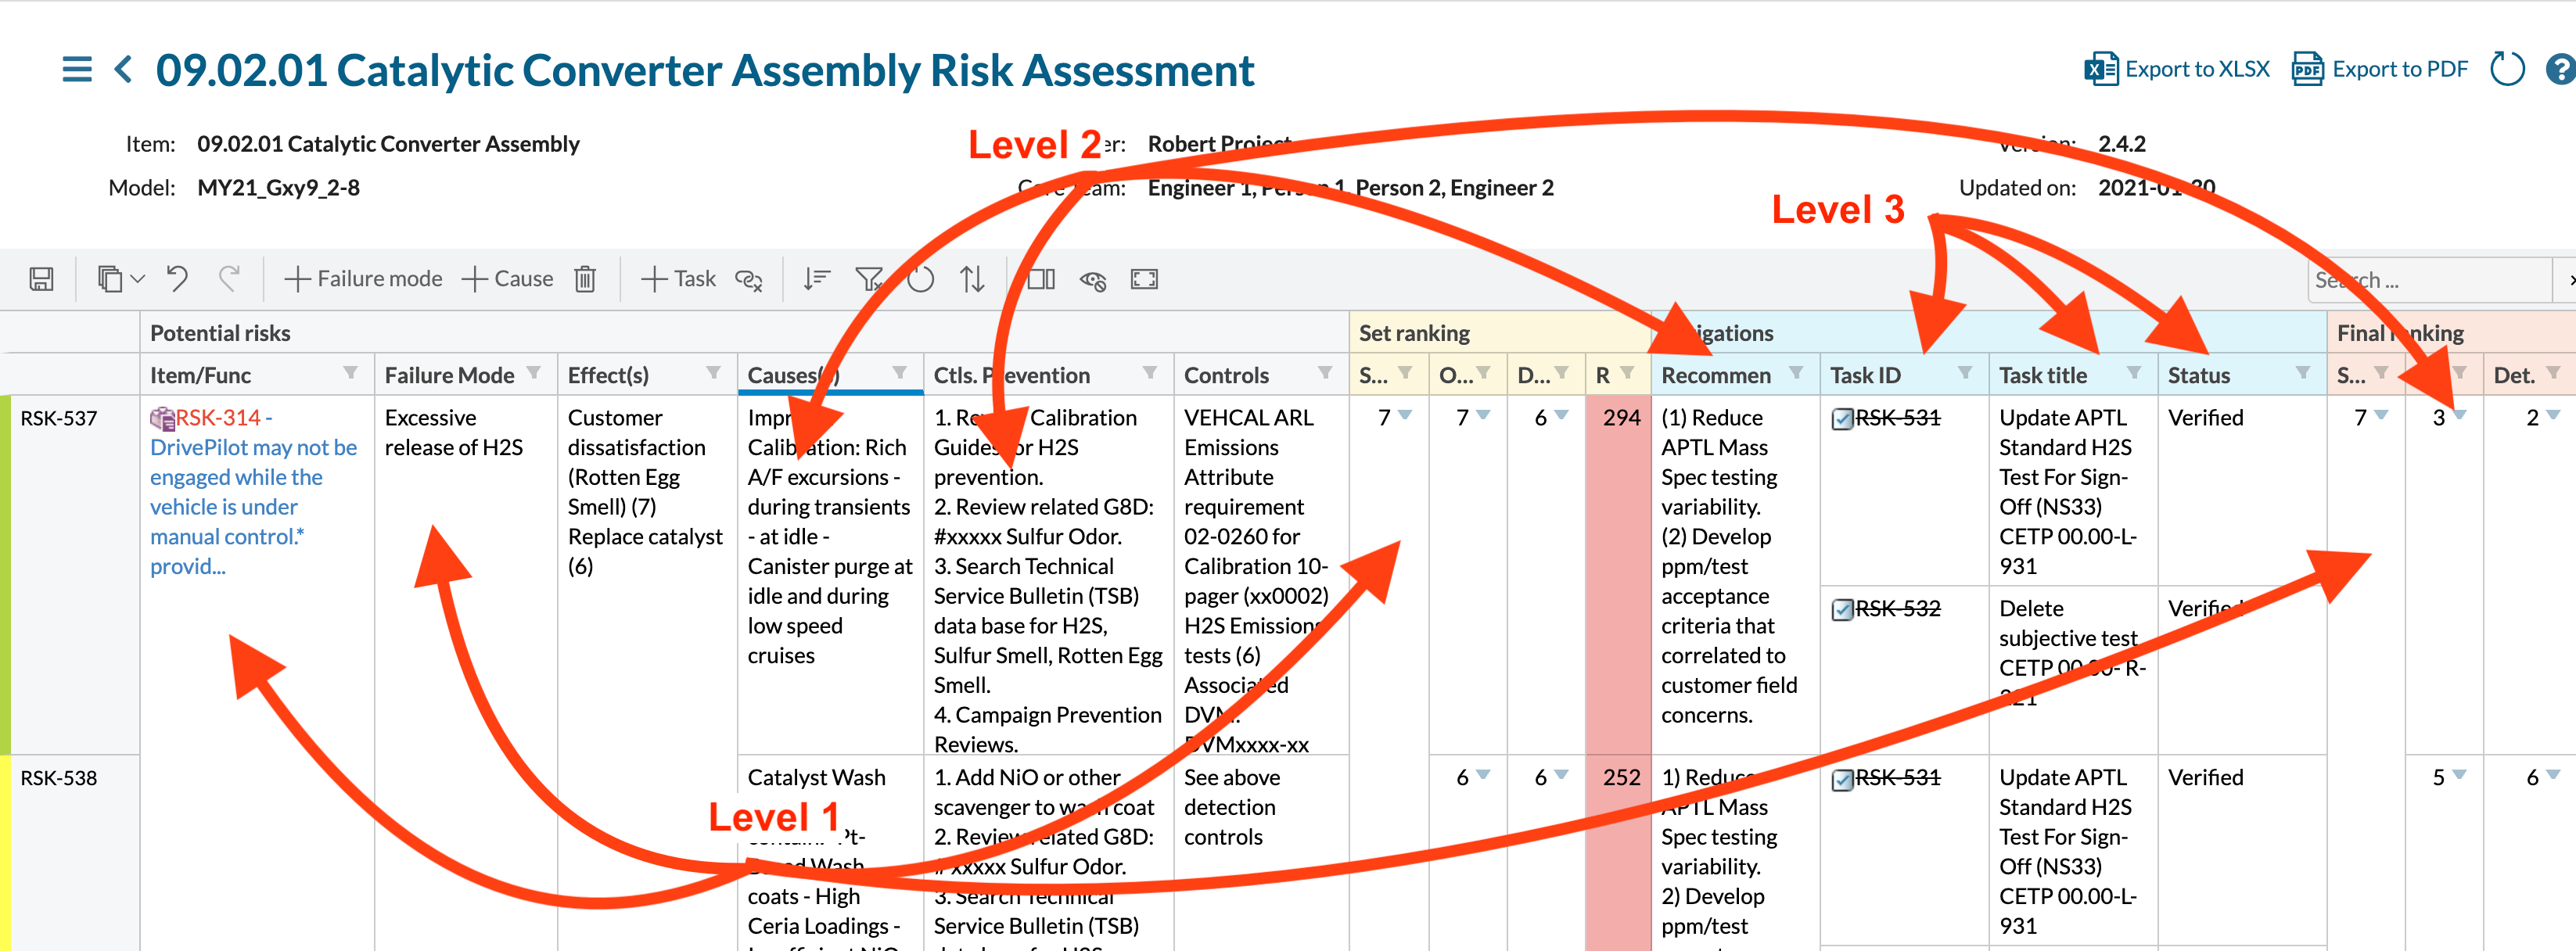
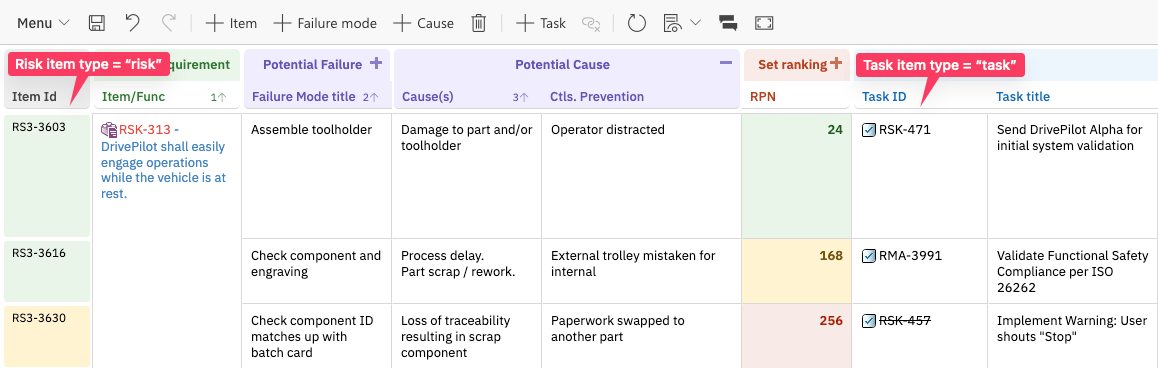
A typical FMEA grid may visually show three columns (Item, Failure Mode, Cause) at three different “levels”, but every row is the same Polarion work item type. The three visual levels exist purely because the
levels array tells Risksheet to merge cells vertically whenever consecutive rows share the same value in a designated control column.
Columns sharing the same level number receive identical cell merging behavior. That is the rule that ties columns to levels.
The levels Array
The levels property is a top-level array in the sheet configuration. Each element defines one visual level in the grid. Every level entry requires three properties: name, controlColumn, and zoomColumn. The showInMenu property is optional.
Level Indexing
Levels in thelevels array are accessed by 0-based index, but the column level property uses 1-based indexing.
1-Indexed vs 0-IndexedThe column
level property is 1-indexed. A column with level: 1 maps to levels[0], level: 2 maps to levels[1], and level: 3 maps to levels[2]. Task-level columns (those bound to task.* fields) have no level assigned; their merging is driven by parent risk and task identity.name Property
The name property defines the human-readable label for each level. This value appears in two locations:
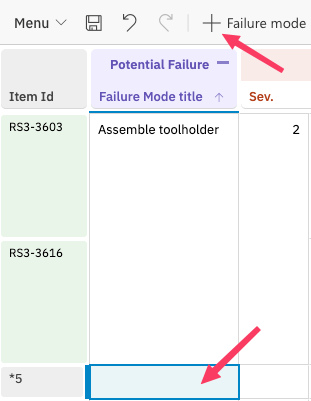
- Menu bar buttons — The ”+” buttons at the top of the grid use the level name (e.g., ”+ Failure Mode”, ”+ System Requirement”).
- Zoom and context menus — The zoom navigation menu and right-click context menu reference the level name when offering create/expand actions.
controlColumn Property
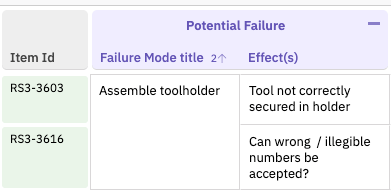
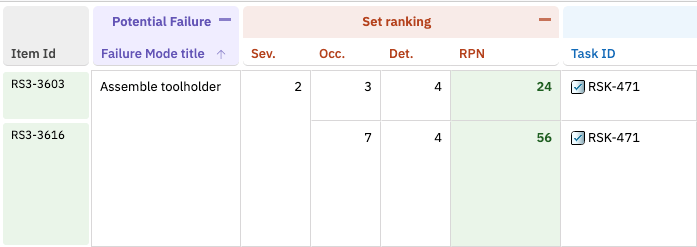
The controlColumn specifies which column controls grouping and cell merging for a level. When multiple consecutive rows share the same value in the control column, the cells in columns assigned to that level merge vertically to create the hierarchical visual structure.
zoomColumn Property
The zoomColumn specifies which column receives focus when a user expands or navigates into a particular level. This provides a zoom navigation experience where expanding a level scrolls to and highlights the specified column. The zoomColumn is a required property on every level entry.
zoomColumn matches the controlColumn (e.g., when grouping and zooming both center on the same item identifier). In other cases the zoomColumn points to a descriptive column while controlColumn points to an identifier column — a common pattern in cause/effect analyses where the cause description is in a separate column from the grouping key.
showInMenu Property
Controls whether the level appears as a creation button in the menu bar and context menu.
showInMenu: false when a level represents items that should only be linked from existing work items, not created directly from the Risksheet.
Interaction with dataTypes
The levels array works together with the dataTypes configuration to define the complete hierarchy. While levels controls the visual grouping and menu structure, dataTypes defines the work item types and link roles for the two real entities (risk and task).

Interaction with sortBy
The sortBy property works with levels to determine the display order of items. Column IDs referenced in sortBy must match the column id values used in the configuration, just as with controlColumn.
Interaction with Column level Property
Each column definition includes a level property that determines which visual level it belongs to. The column level value is 1-based: level: 1 maps to levels[0], level: 2 maps to levels[1], and so on. Columns assigned to the same level share identical cell merging behavior.
title column belongs to the first visual level (levels[0], “Failure Mode”) and the sysReq column belongs to the second visual level (levels[1], “System Requirement”). Task columns bound to task.* fields have no level assigned — their merging is driven by parent risk identity and task linkage.
Complete Example
The following sheet configuration excerpt demonstrates a two-level FMEA configuration with a risk item level and an upstream system requirement level, plus downstream mitigation tasks.levels[0](“Failure Mode”) rows display Failure Mode fields (title, severity, occurrence, detection, RPN). Cells in columns withlevel: 1merge vertically when consecutive rows share the samesystemItemId.levels[1](“System Requirement”) rows display linked System Requirements. Cells in columns withlevel: 2merge so multiple Failure Modes linked to the same Requirement group together (controlled bysysReq).- Task rows display downstream mitigation tasks linked to each Failure Mode. Task columns have no
levelassigned; merging is by parent risk and task identity. - The menu bar shows three creation buttons: ”+ Failure Mode”, ”+ System Requirement”, and ”+ Task”.
Common Configuration Errors
See Also
- Configuration Properties Index — Full list of all sheet configuration properties
- Sheet Configuration Format — Overall configuration file structure
- Column Type Reference — Column
typeandlevelproperty details - Item Link Columns — Configuring upstream link columns used in levels
- Task Link Columns — Configuring downstream task columns