1
Enable the Resource View
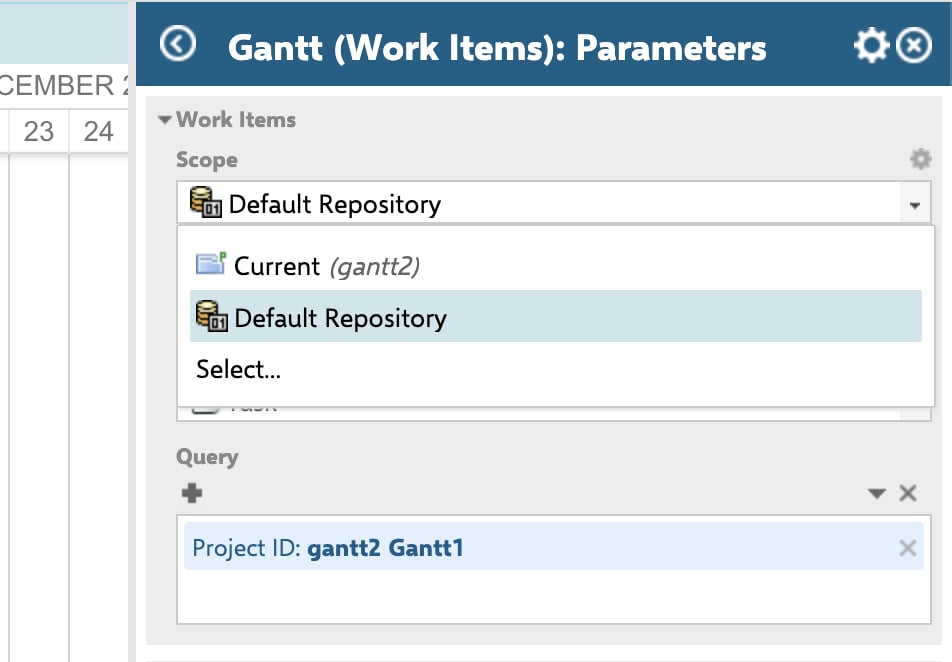
- Open the Gantt page in Edit mode.
- Click the widget gear icon to open Widget Parameters.
- In the Resource View section, set Show Resource View to Yes.
- Click Apply.
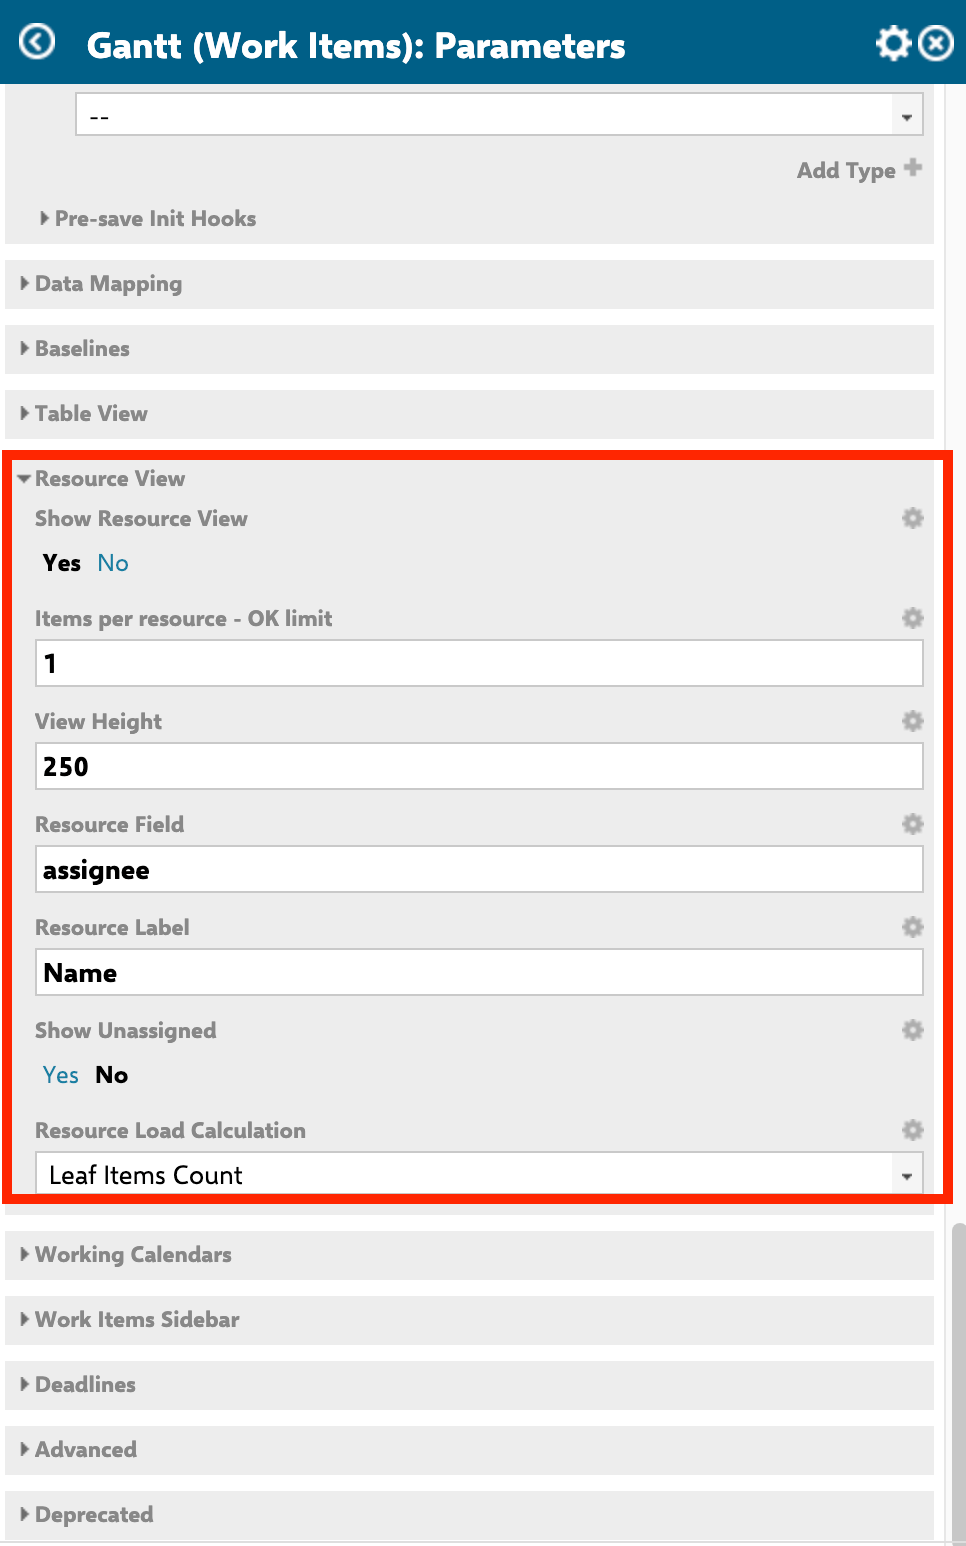
Resource view sub-parameters such as View Height, Resource Field, and Resource Load Calculation only become visible after you set Show Resource View to Yes.
2
Configure Resource View Parameters
3
Choose a Resource Load Calculation Mode
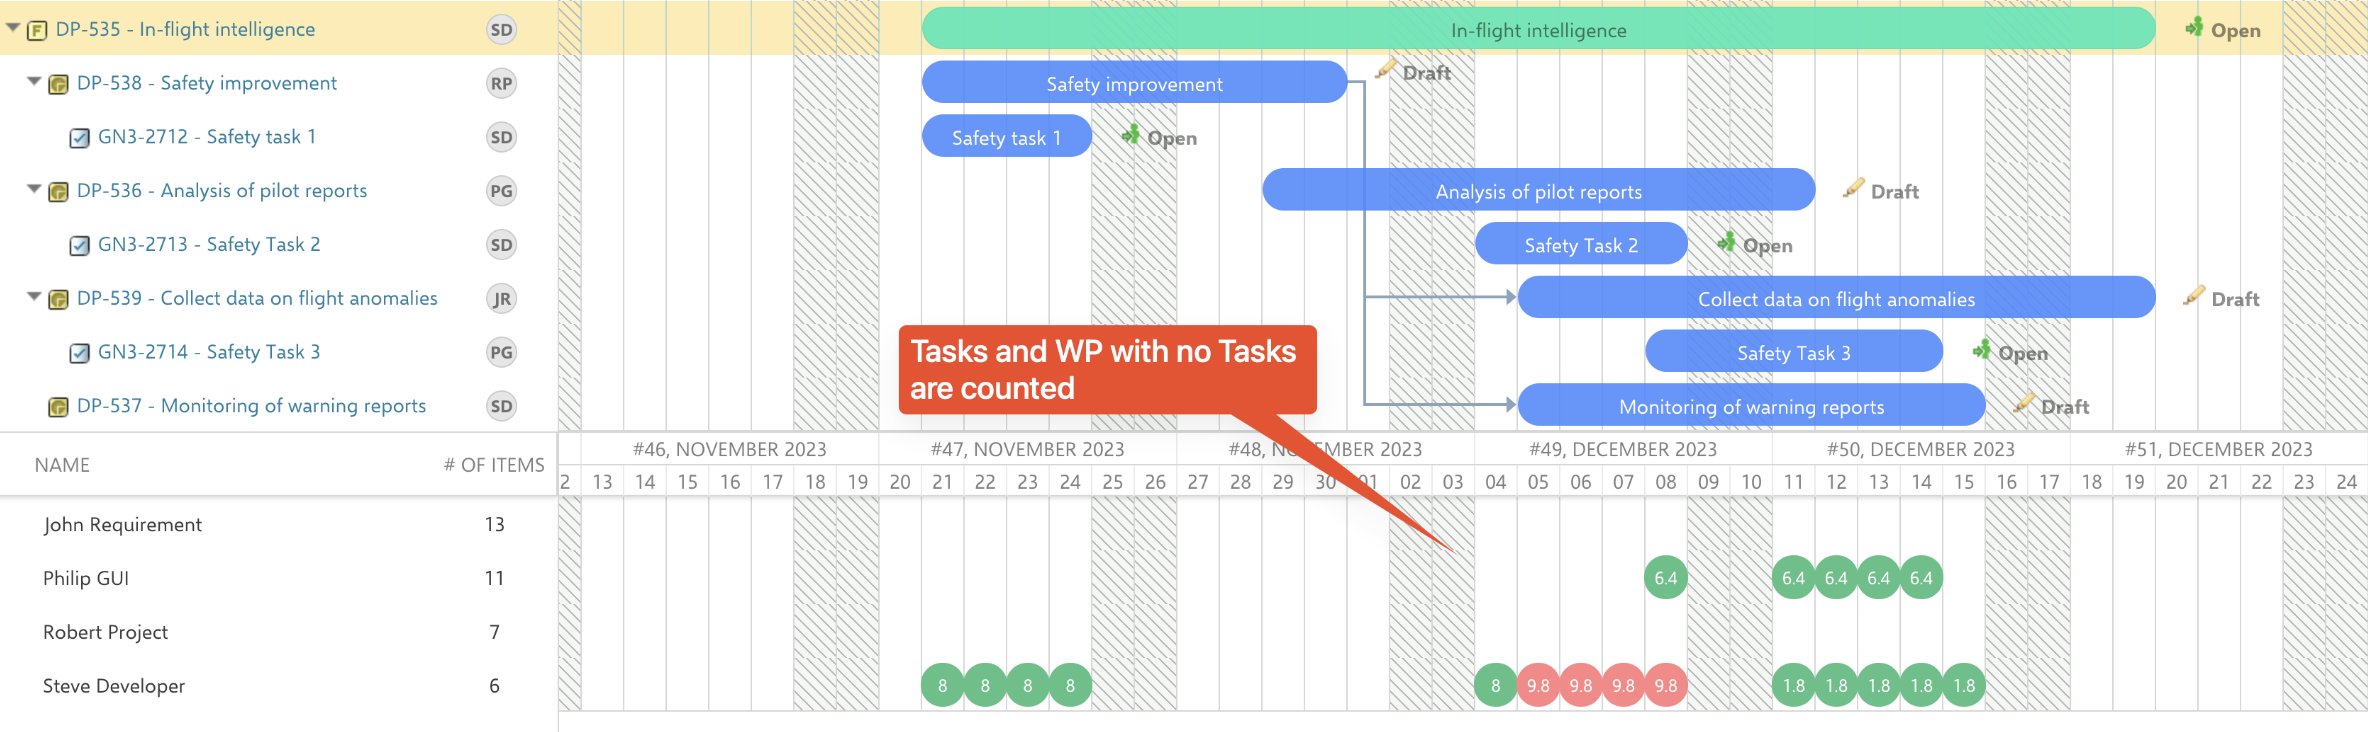
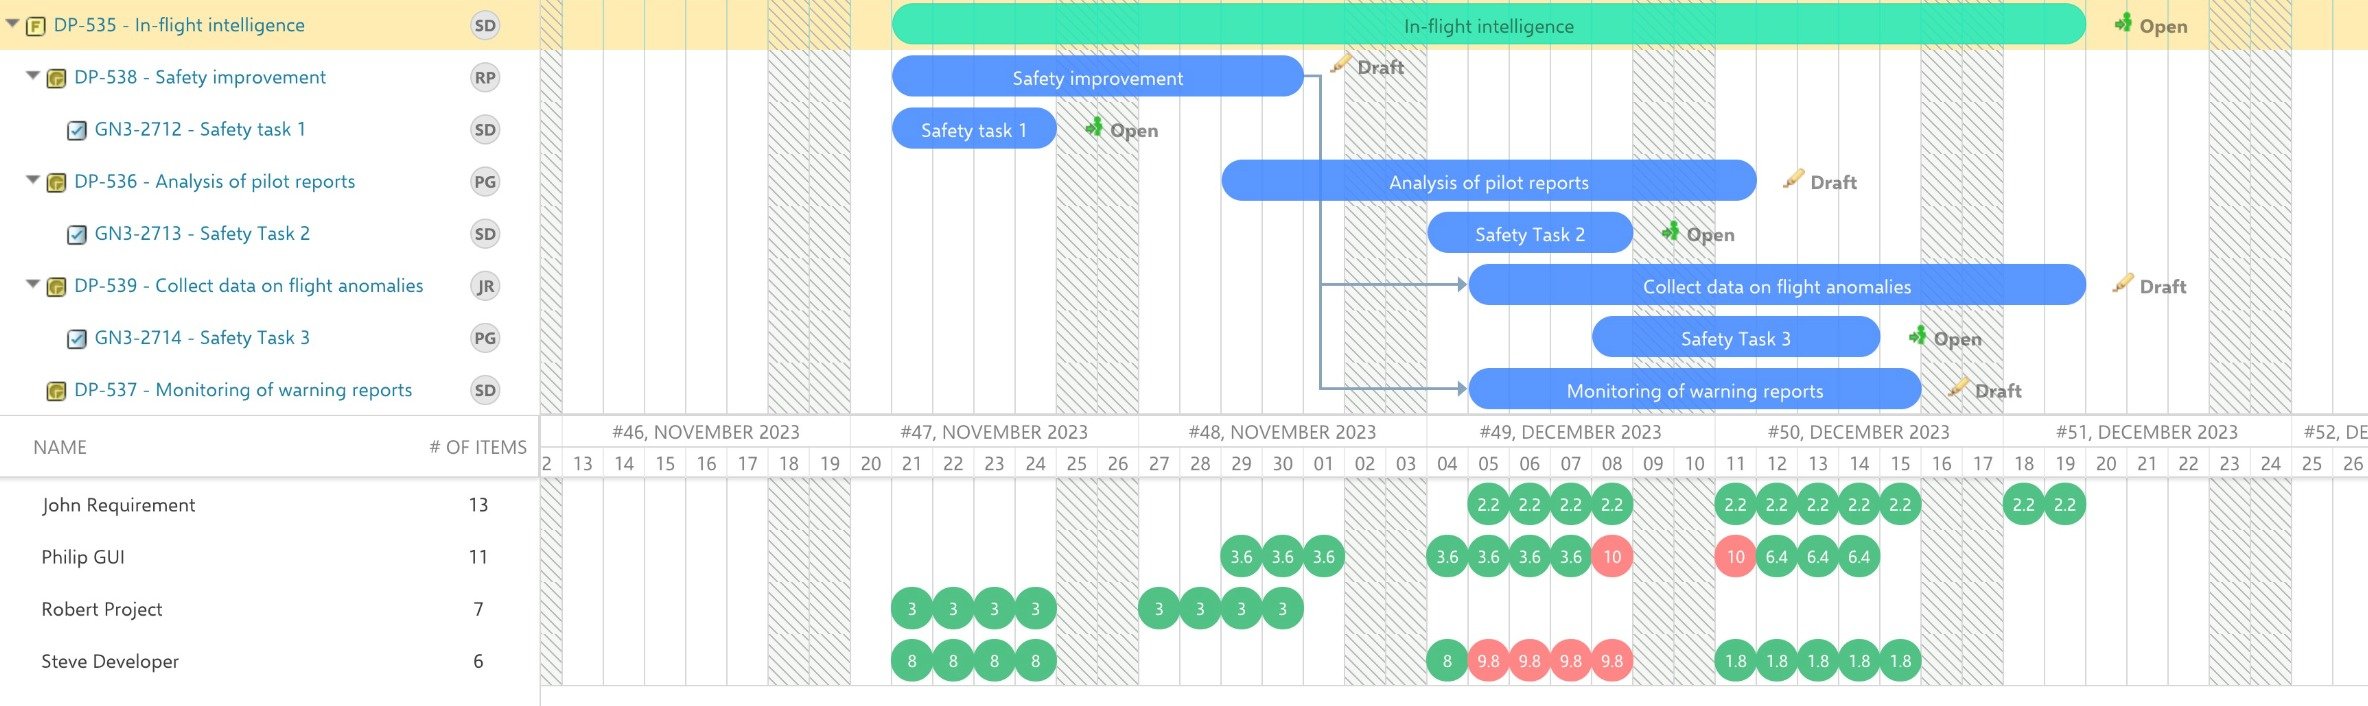
The Gantt offers four calculation modes for the resource view cells: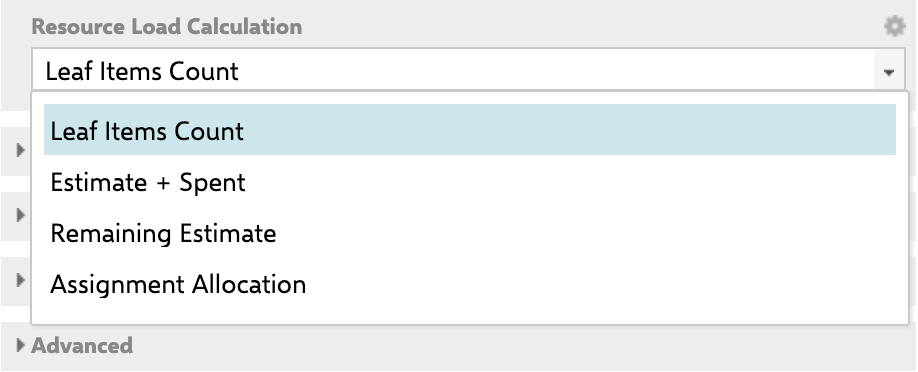
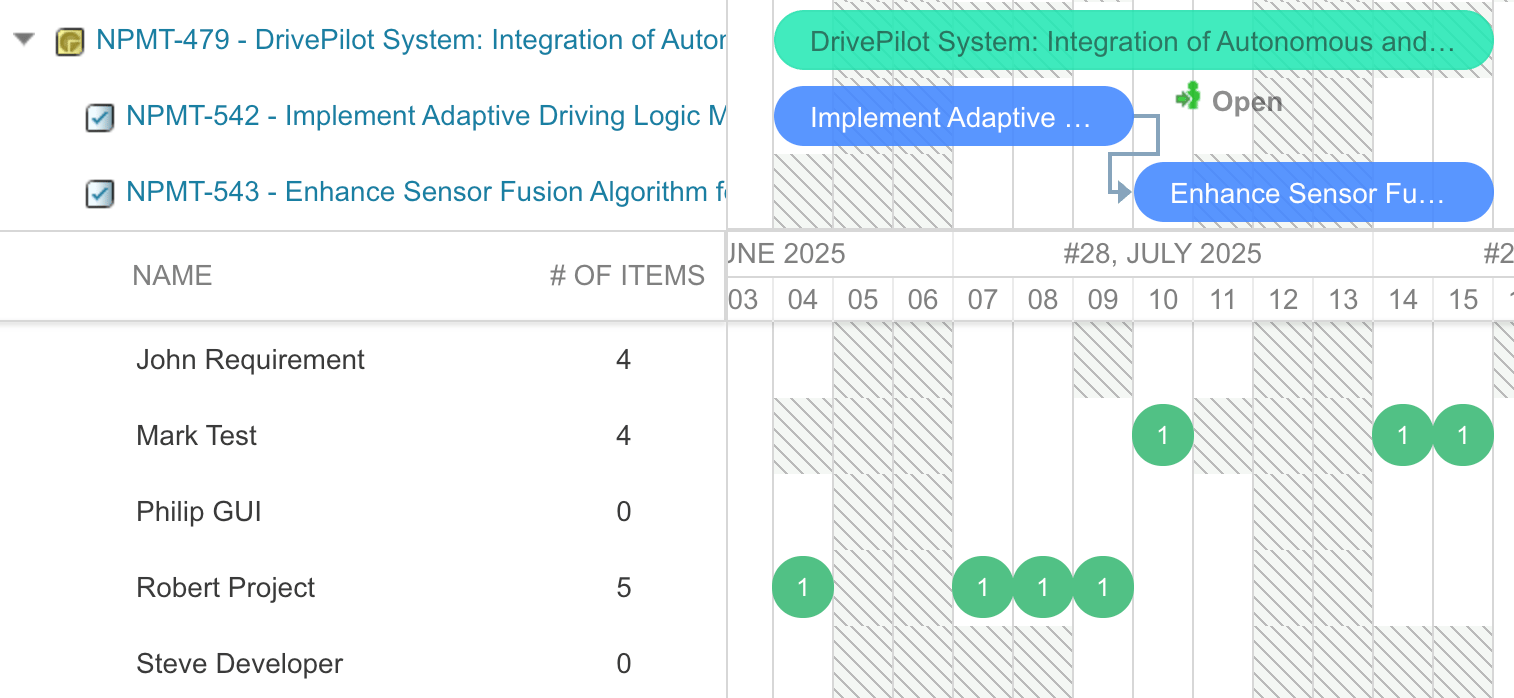
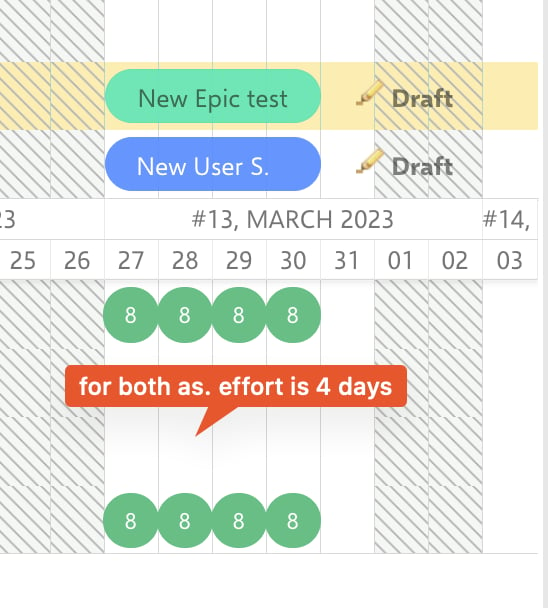
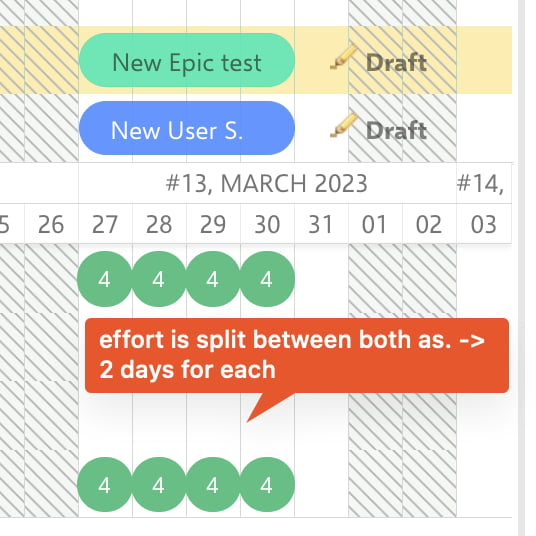
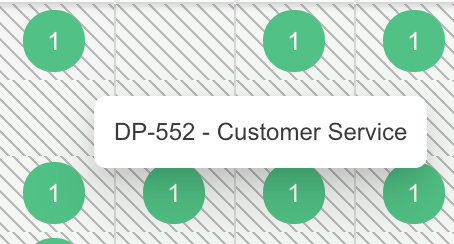
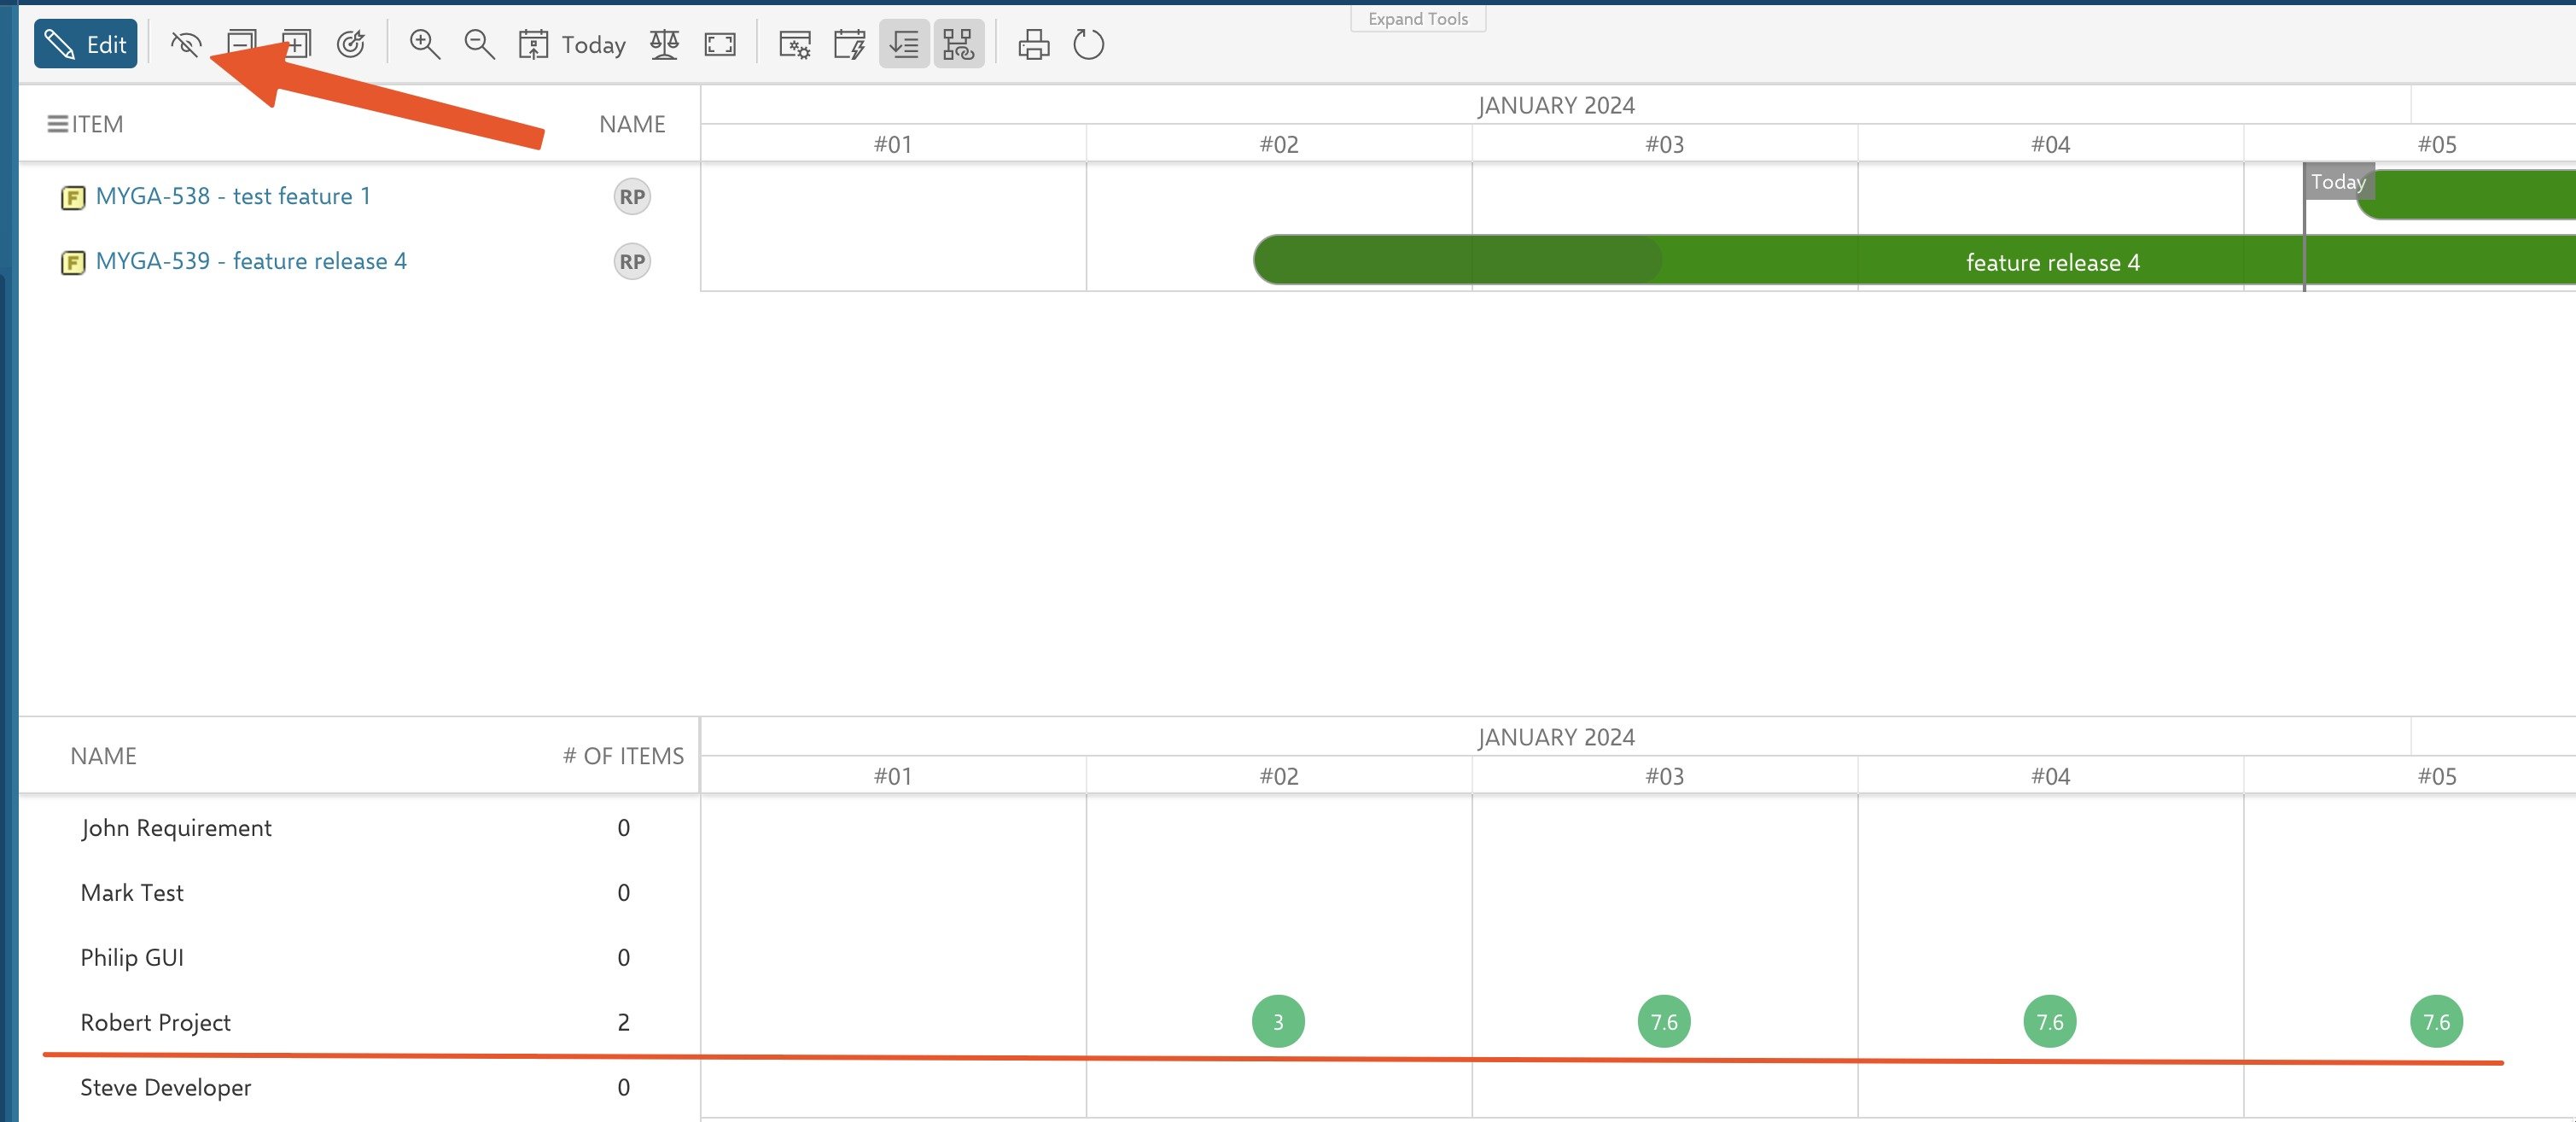
Leaf Items Count counts each leaf-level item as one unit. In the example below, the two leaf items each contribute a green cell marked “1” for their scheduled timeframe.
nextedy.gantt.multiAssignmentSameEffortForAll=false to Administration > Configuration Properties.4
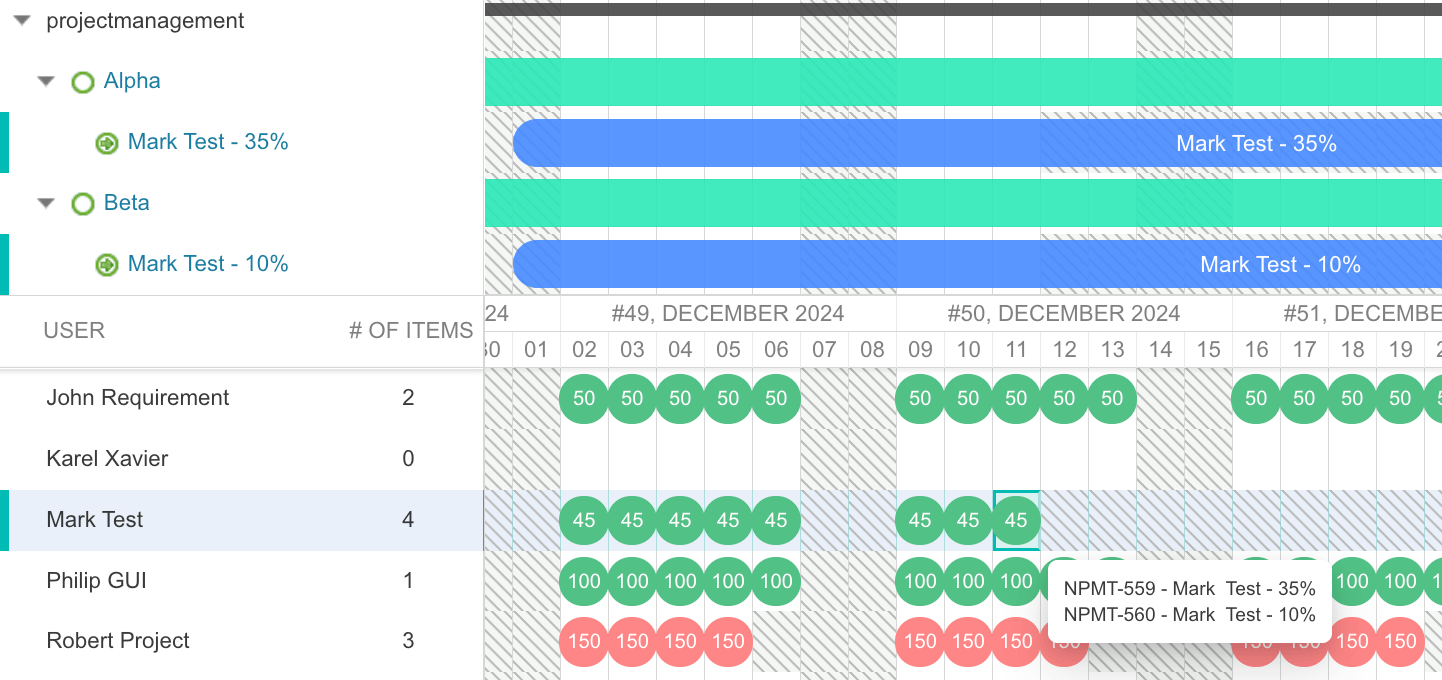
Show Unassigned Work Items
To see work items that have no resource assigned:
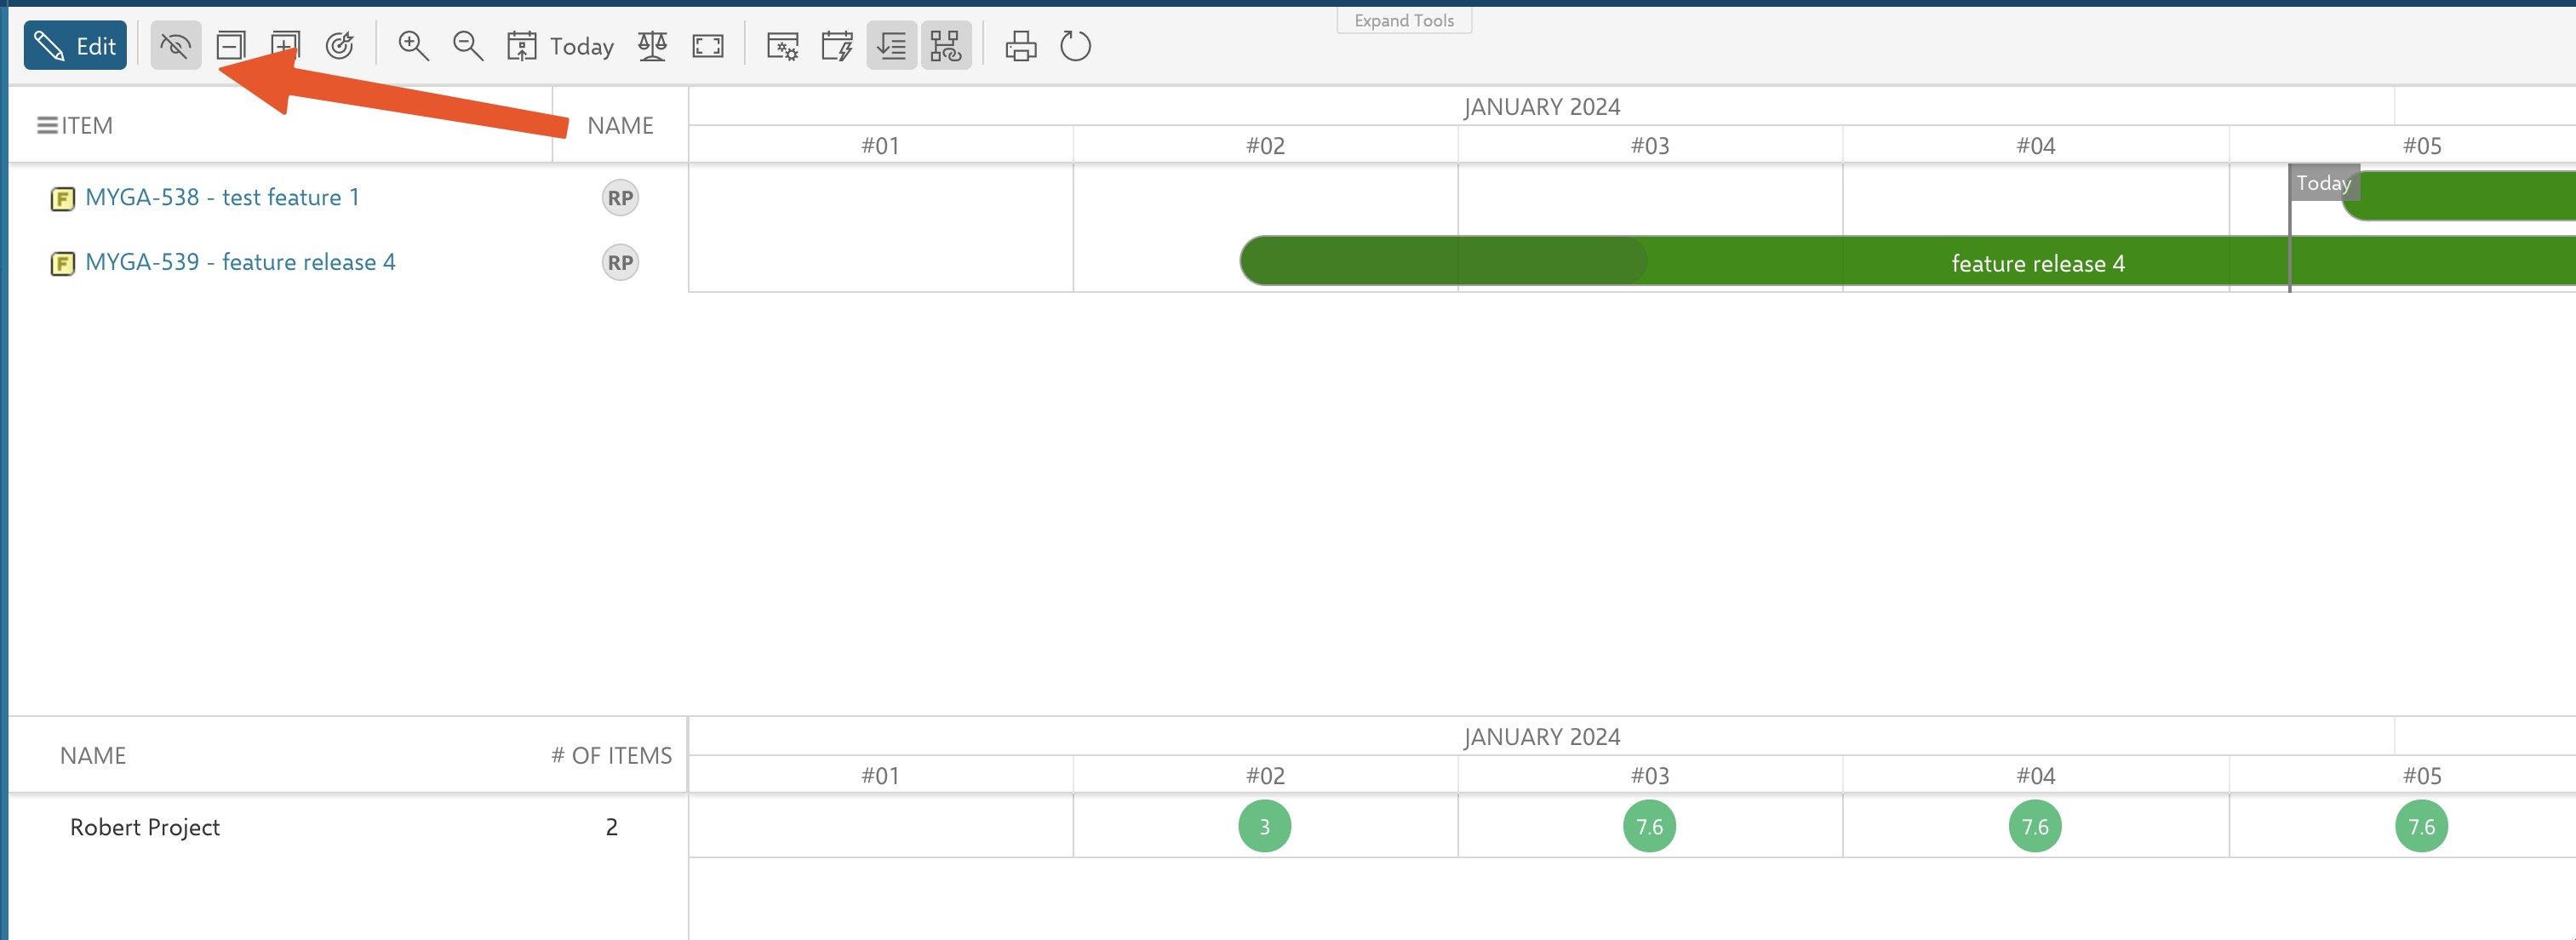
- Set Show Unassigned to Yes in the Resource View parameters.
- A dedicated row labeled “Unassigned” appears at the bottom of the resource view.
5
Adjust the View Height
You can set the initial panel height via the View Height parameter. After the Gantt loads, you can also resize the resource view by dragging the horizontal divider between the Gantt chart and the resource view.
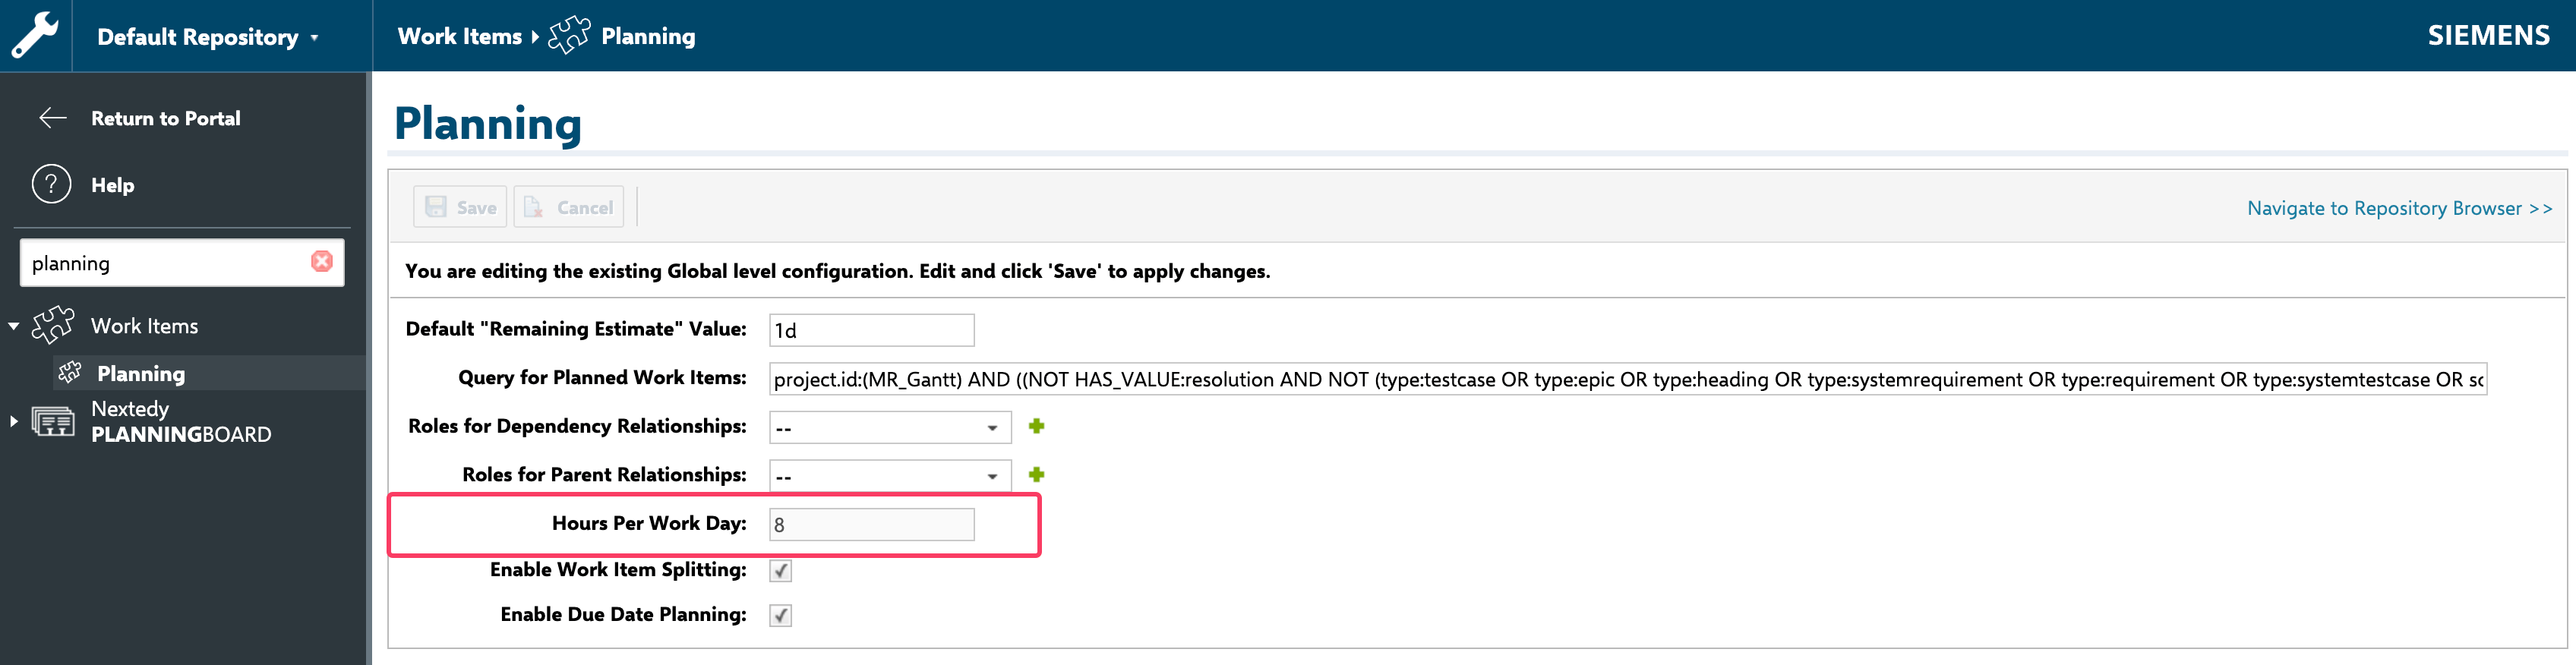
6
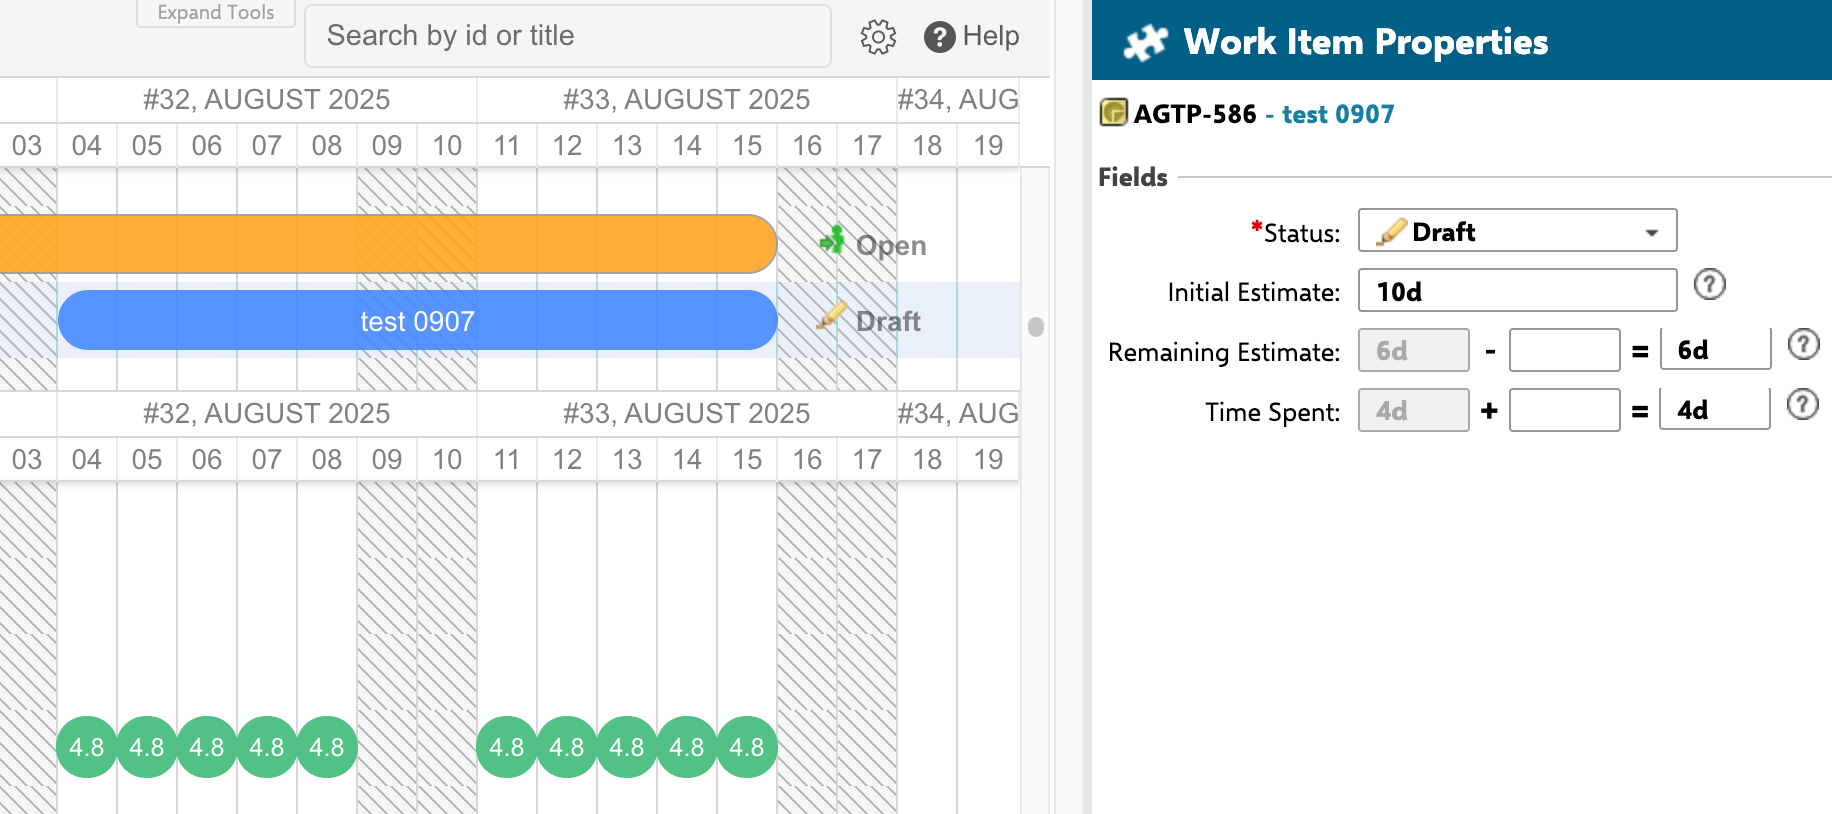
Customize Marker Colors
Resource allocation markers use color coding to indicate capacity status: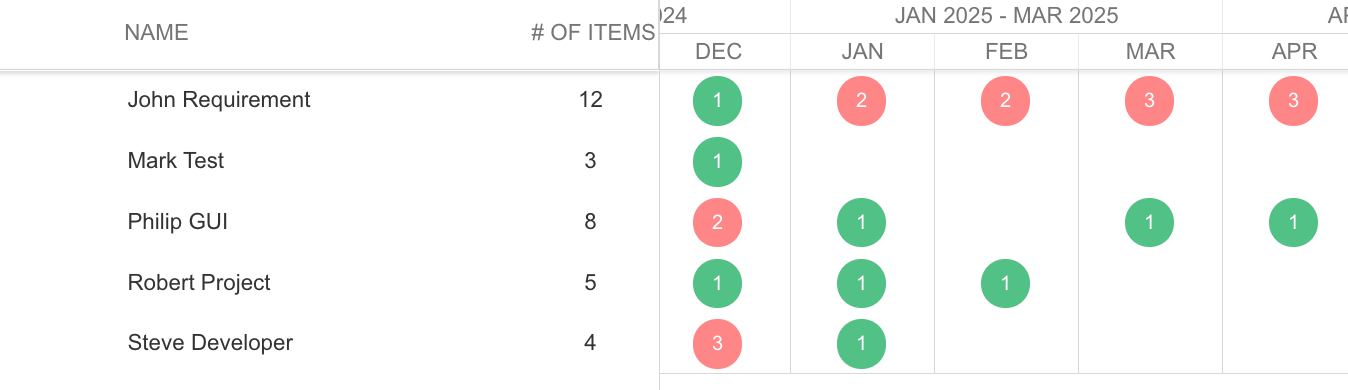

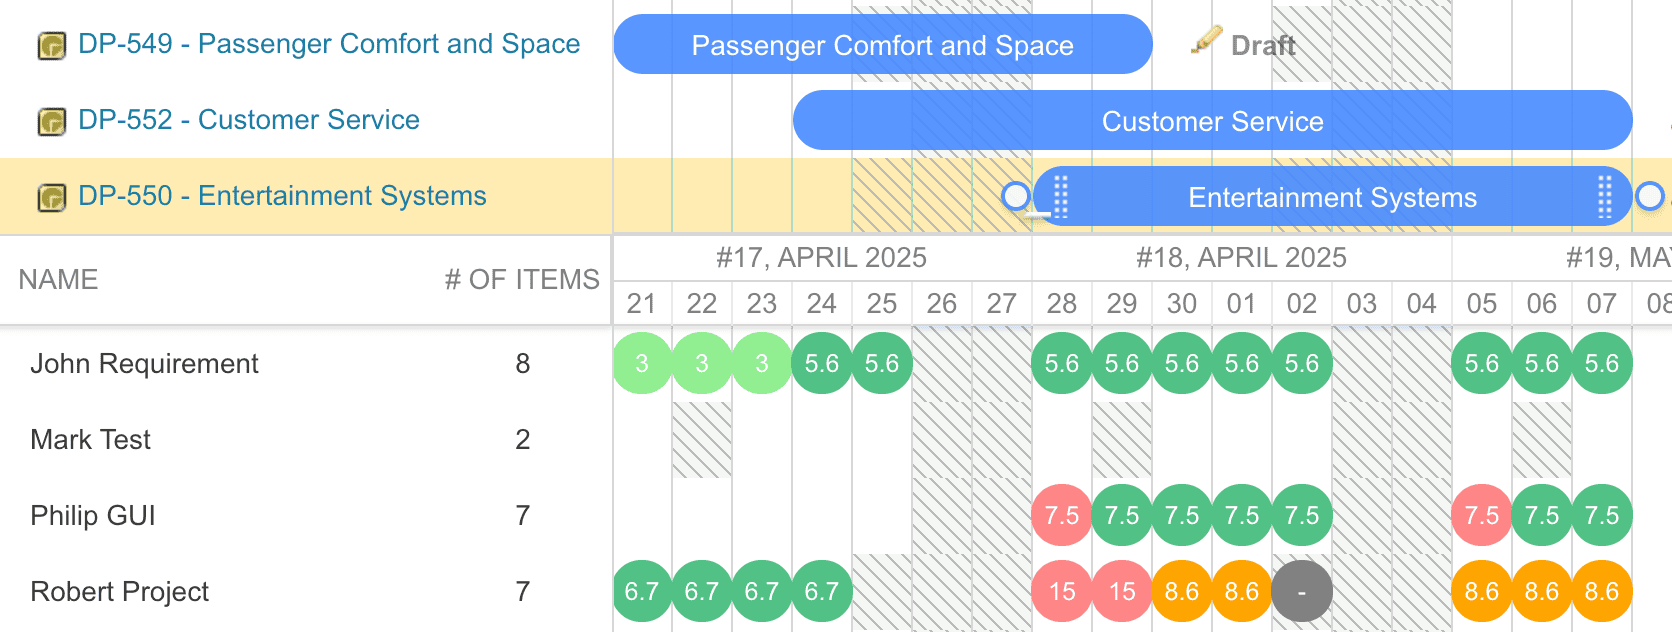
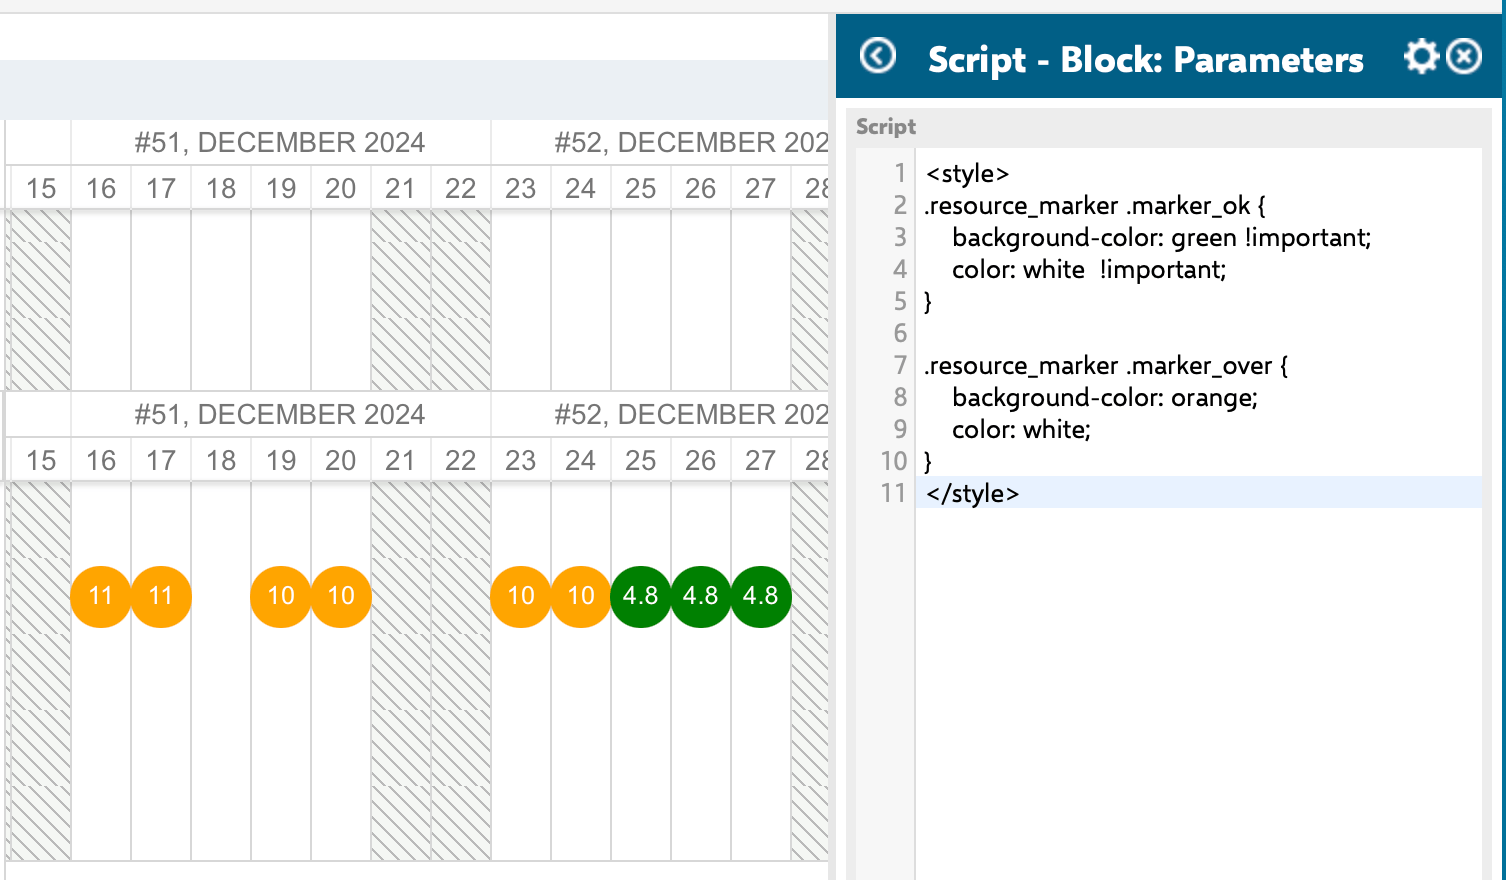
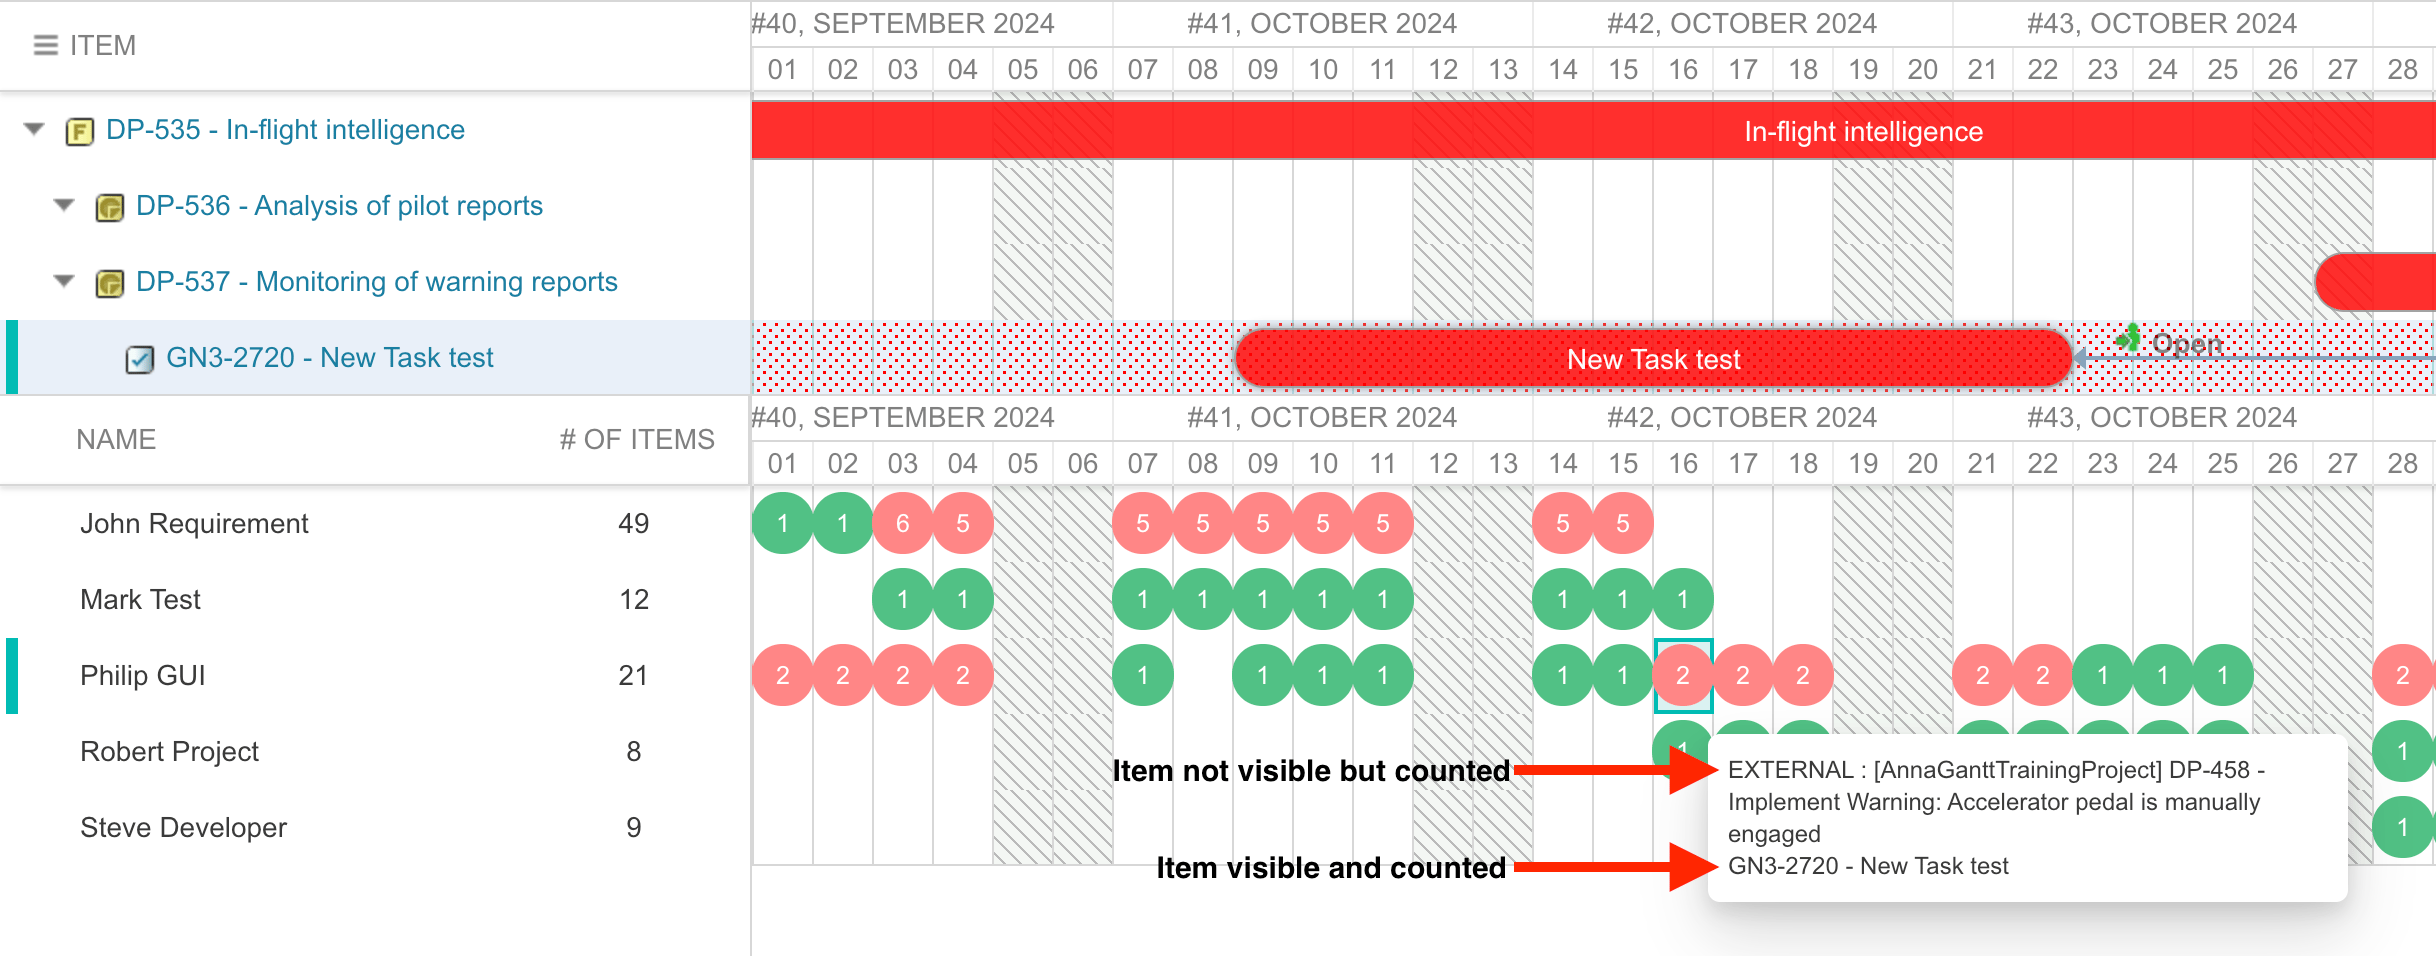
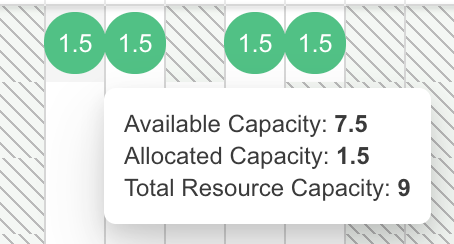
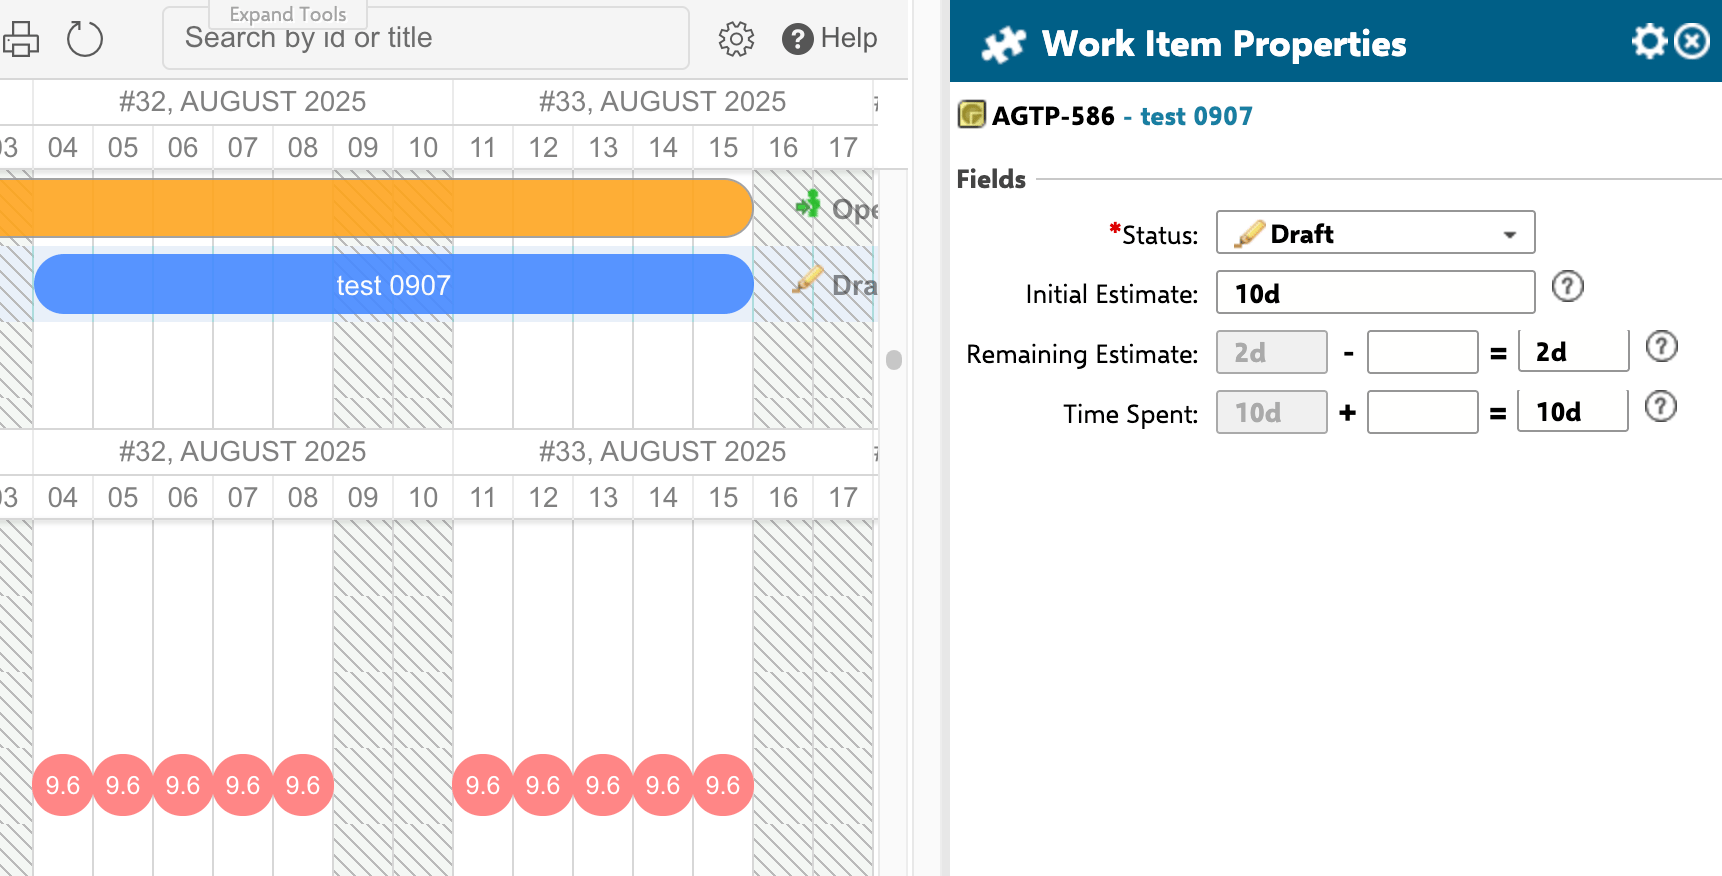
- Green cells indicate the resource is within capacity
- Red cells indicate the resource is overallocated
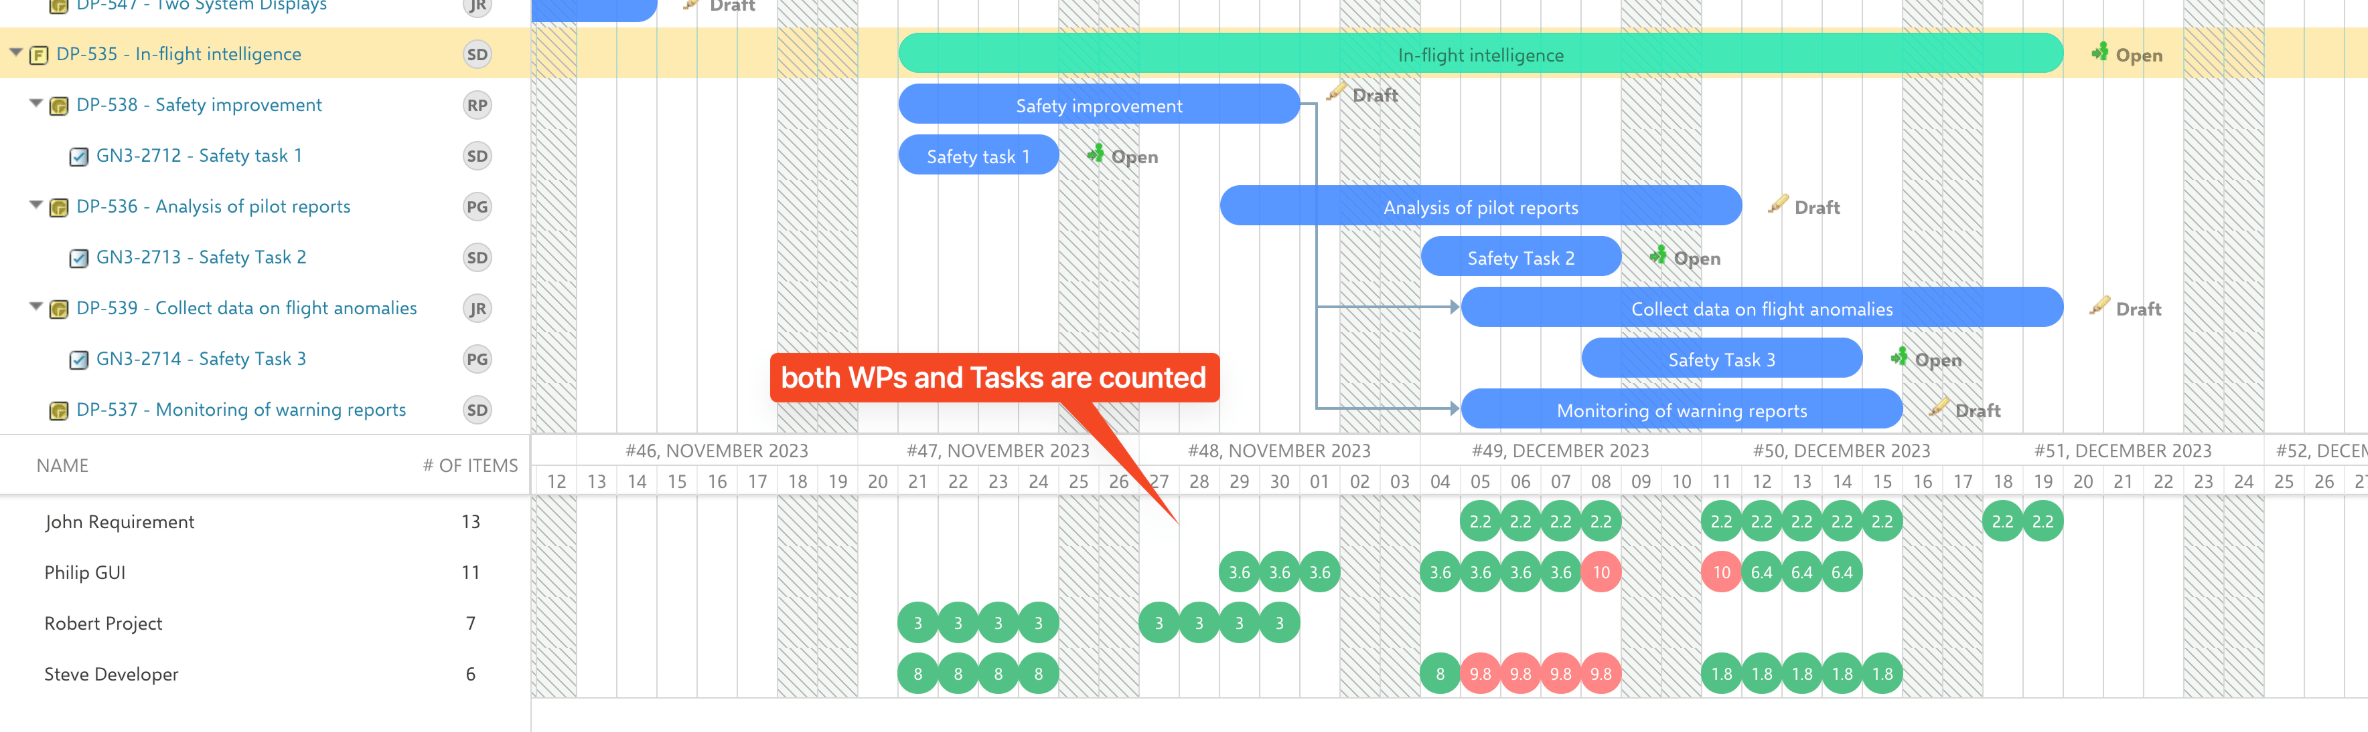
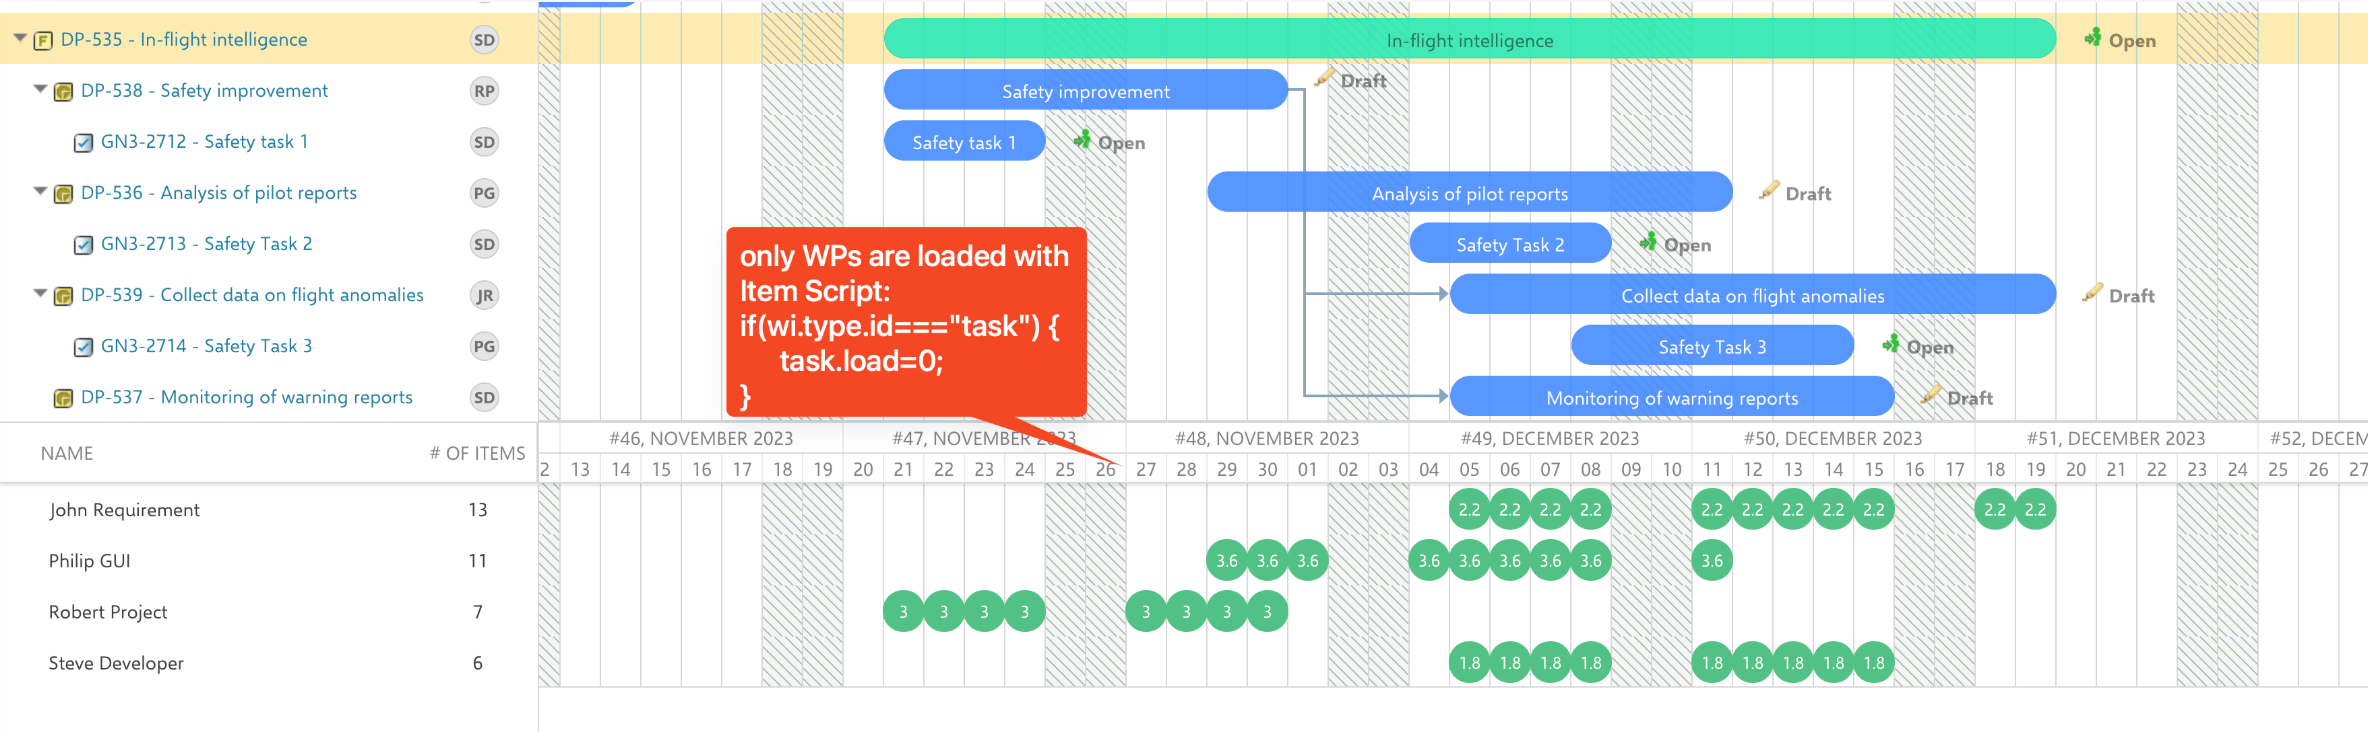
#51c185 up to 100%, orange up to 150%, and #ff8686 above 150%.nextedy.gantt.config.onlyLeafTasks=false in Widget Properties > Gantt Config Script.if(wi.getType().getId()==="task") { task.load=0; }.Verification
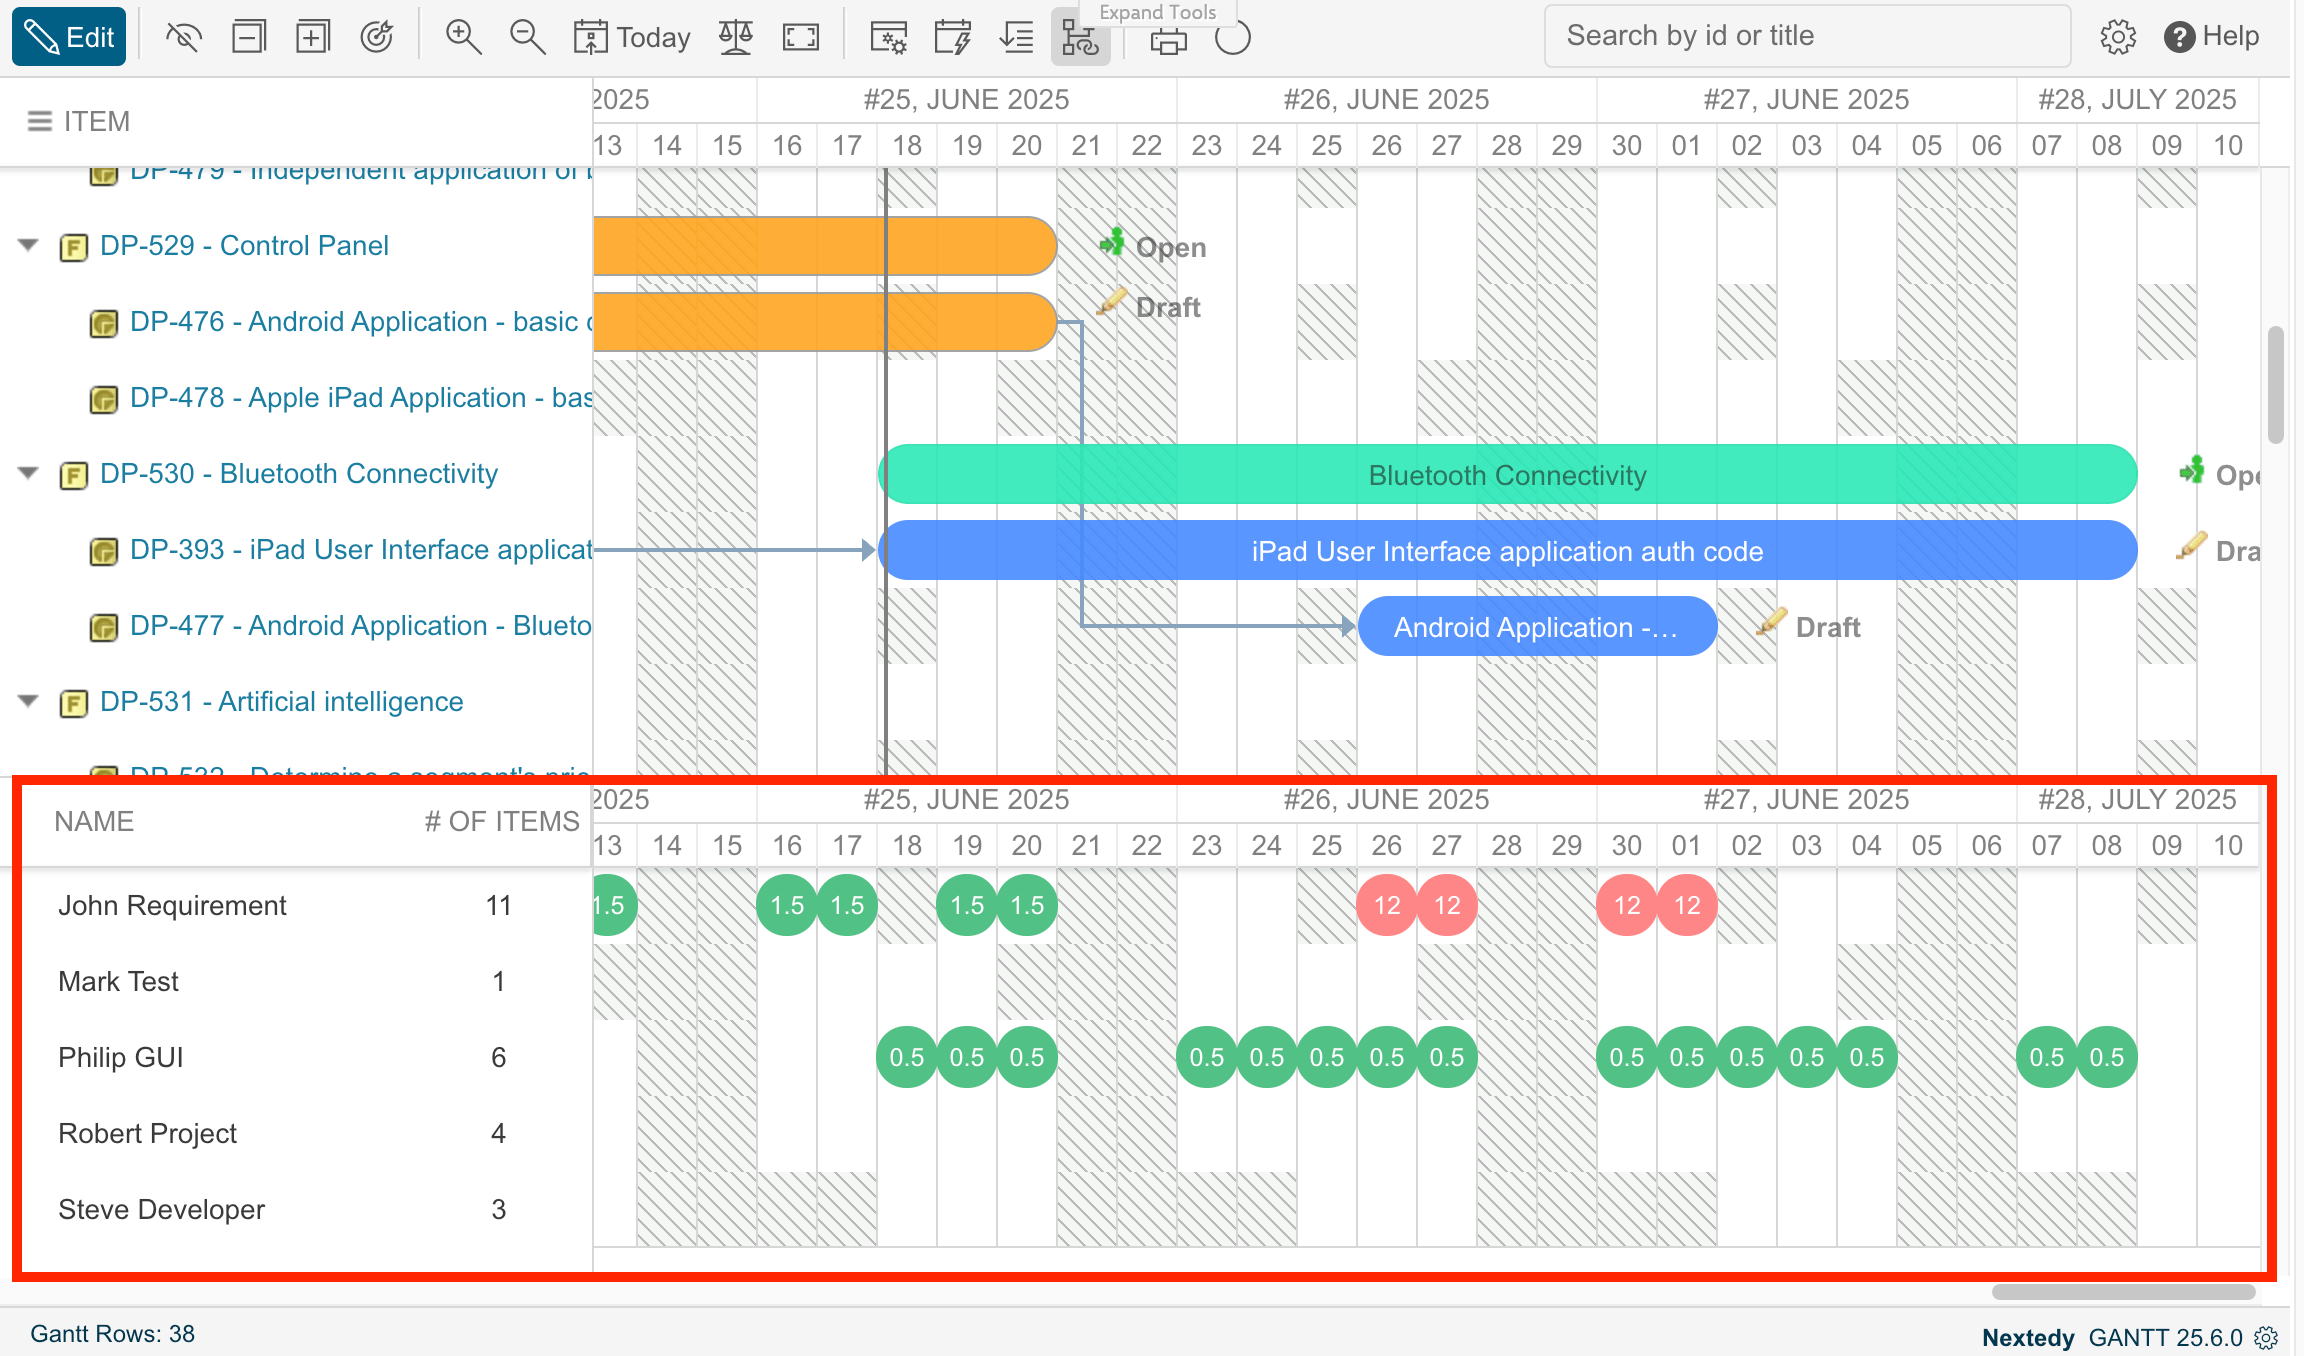
You should now see:- A resource view panel below the Gantt chart with one row per assigned resource
- Workload values in each cell matching your chosen calculation mode
- Color-coded cells indicating within-capacity (green) and overallocation (red) states