> ## Documentation Index
> Fetch the complete documentation index at: https://learn.nextedy.com/llms.txt
> Use this file to discover all available pages before exploring further.
# Render Custom Data
> Use custom cell renderers and server-side rendering to display specialized data formats in Nextedy RISKSHEET columns, going beyond the standard text, enum, and link column types.
export const LastReviewed = ({date}) => {
if (!date) return null;
const formatted = new Date(`${date}T00:00:00Z`).toLocaleDateString("en-US", {
year: "numeric",
month: "long",
day: "numeric",
timeZone: "UTC"
});
return
Last reviewed on {formatted}
;
};
## Rendering Options Overview
Risksheet offers two approaches for custom data rendering:
| Approach | Column Property | Editable | Rendering Location |
| -------------------- | --------------- | ------------------------ | ------------------------ |
| Client-side renderer | `cellRenderer` | Column remains editable | Browser (JavaScript) |
| Server-side renderer | `serverRender` | Column becomes read-only | Server (Velocity script) |
The column property `cellRenderer` references a function name defined in the `cellDecorators` section of the sheet configuration. Add the renderer function under `cellDecorators`, then point the column at it:
```yaml theme={null}
cellDecorators:
riskLevelRenderer: "function(info){ var val = info.value; $(info.cell).html('' + val + ''); }"
columns:
- id: riskLevel
bindings: riskLevel
header: Risk Level
cellRenderer: riskLevelRenderer
width: 120
```
The function receives an `info` object exposing `info.value` (current cell value), `info.cell` (the DOM element), and `info.item` (the full row data). It can modify the cell's HTML content and styling.
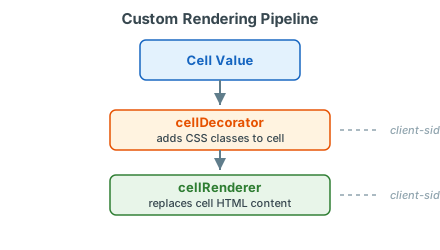
 The `cellRenderer` column property and the `cellDecorators` config section are interlinked: `cellRenderer: "rpn"` references the function `cellDecorators.rpn`. By convention, renderers replace the cell's HTML content, while decorators apply CSS classes via `toggleClass` without changing content. Use renderers for custom HTML; use decorators for conditional styling.
For complex rendering that requires access to Polarion data relationships or cross-item queries, use `serverRender` with a Velocity template:
```yaml theme={null}
columns:
- id: linkedRequirements
bindings: linkedReqs
header: Linked Requirements
serverRender: linkedItemsRenderer
width: 200
```
When you set `serverRender` on a column, it automatically becomes `type: text` and `readOnly: true`. Users cannot edit server-rendered columns.
Cell decorators apply CSS classes to cells based on their values. Define the function in `cellDecorators` and the visual styling in `styles`. Cell decorators MUST use `toggleClass` (not inline styles), because the grid reuses cell DOM elements across rows:
```yaml theme={null}
cellDecorators:
severity: "function(info){ var val = info.value; $(info.cell).toggleClass('high-severity', val >= 8); $(info.cell).toggleClass('medium-severity', val >= 4 && val < 8); $(info.cell).toggleClass('low-severity', val < 4); }"
styles:
".high-severity": "{background-color: #f8eae7 !important; color: #ab1c00 !important;}"
".medium-severity": "{background-color: #fff3d2 !important; color: #735602 !important;}"
".low-severity": "{background-color: #eaf5e9 !important; color: #1d5f20 !important;}"
```
The `cellRenderer` column property and the `cellDecorators` config section are interlinked: `cellRenderer: "rpn"` references the function `cellDecorators.rpn`. By convention, renderers replace the cell's HTML content, while decorators apply CSS classes via `toggleClass` without changing content. Use renderers for custom HTML; use decorators for conditional styling.
For complex rendering that requires access to Polarion data relationships or cross-item queries, use `serverRender` with a Velocity template:
```yaml theme={null}
columns:
- id: linkedRequirements
bindings: linkedReqs
header: Linked Requirements
serverRender: linkedItemsRenderer
width: 200
```
When you set `serverRender` on a column, it automatically becomes `type: text` and `readOnly: true`. Users cannot edit server-rendered columns.
Cell decorators apply CSS classes to cells based on their values. Define the function in `cellDecorators` and the visual styling in `styles`. Cell decorators MUST use `toggleClass` (not inline styles), because the grid reuses cell DOM elements across rows:
```yaml theme={null}
cellDecorators:
severity: "function(info){ var val = info.value; $(info.cell).toggleClass('high-severity', val >= 8); $(info.cell).toggleClass('medium-severity', val >= 4 && val < 8); $(info.cell).toggleClass('low-severity', val < 4); }"
styles:
".high-severity": "{background-color: #f8eae7 !important; color: #ab1c00 !important;}"
".medium-severity": "{background-color: #fff3d2 !important; color: #735602 !important;}"
".low-severity": "{background-color: #eaf5e9 !important; color: #1d5f20 !important;}"
```
 A common pattern is using a formula to compute a value and a decorator to style it. RPN thresholds are configurable per deployment — pick the values that match your risk scale:
```yaml theme={null}
formulas:
commonRpn: "function(info){ var value = info.item['occ']*info.item['det']*info.item['sev']; return value?value:null; }"
cellDecorators:
rpn: "function(info){ var val = info.value; $(info.cell).toggleClass('rpn1', val>0 && val <= 150); $(info.cell).toggleClass('rpn2', val > 150 && val <= 250); $(info.cell).toggleClass('rpn3', val > 250); }"
columns:
- id: rpn
bindings: rpn
header: RPN
formula: commonRpn
width: 70
```
The formula calculates the RPN value; the cell decorator applies color coding based on the result.
Custom cell renderers are skipped when the Risksheet is in baseline comparison mode. The comparison highlighting takes precedence to clearly show changes between versions.
## Verification
Save the sheet configuration through the configuration editor (YAML editing is supported in v25.5.0+) and reload your Risksheet. You should now see cells with custom rendering applied. For cell decorators, verify that the conditional CSS classes are applied by inspecting that cells display the correct background colors based on their values.
## See Also
* [Apply Conditional Formatting](/risksheet/guides/styling/conditional-formatting) -- style-based formatting
* [Configure Cell Styles](/risksheet/guides/styling/cell-styles) -- CSS class definitions
* [Customize Link Rendering](/risksheet/guides/columns/custom-link-rendering) -- customize how links display
* [Create Custom Renderers](/risksheet/guides/customization/custom-renderers) -- advanced renderer patterns
* [Configure Calculated Columns](/risksheet/guides/columns/calculated-columns) -- formula-driven columns
A common pattern is using a formula to compute a value and a decorator to style it. RPN thresholds are configurable per deployment — pick the values that match your risk scale:
```yaml theme={null}
formulas:
commonRpn: "function(info){ var value = info.item['occ']*info.item['det']*info.item['sev']; return value?value:null; }"
cellDecorators:
rpn: "function(info){ var val = info.value; $(info.cell).toggleClass('rpn1', val>0 && val <= 150); $(info.cell).toggleClass('rpn2', val > 150 && val <= 250); $(info.cell).toggleClass('rpn3', val > 250); }"
columns:
- id: rpn
bindings: rpn
header: RPN
formula: commonRpn
width: 70
```
The formula calculates the RPN value; the cell decorator applies color coding based on the result.
Custom cell renderers are skipped when the Risksheet is in baseline comparison mode. The comparison highlighting takes precedence to clearly show changes between versions.
## Verification
Save the sheet configuration through the configuration editor (YAML editing is supported in v25.5.0+) and reload your Risksheet. You should now see cells with custom rendering applied. For cell decorators, verify that the conditional CSS classes are applied by inspecting that cells display the correct background colors based on their values.
## See Also
* [Apply Conditional Formatting](/risksheet/guides/styling/conditional-formatting) -- style-based formatting
* [Configure Cell Styles](/risksheet/guides/styling/cell-styles) -- CSS class definitions
* [Customize Link Rendering](/risksheet/guides/columns/custom-link-rendering) -- customize how links display
* [Create Custom Renderers](/risksheet/guides/customization/custom-renderers) -- advanced renderer patterns
* [Configure Calculated Columns](/risksheet/guides/columns/calculated-columns) -- formula-driven columns