> ## Documentation Index
> Fetch the complete documentation index at: https://learn.nextedy.com/llms.txt
> Use this file to discover all available pages before exploring further.
# Understanding the Interface
export const LastReviewed = ({date}) => {
if (!date) return null;
const formatted = new Date(`${date}T00:00:00Z`).toLocaleDateString("en-US", {
year: "numeric",
month: "long",
day: "numeric",
timeZone: "UTC"
});
return
Last reviewed on {formatted}
;
};
## What you will achieve
By the end of this tutorial, you will be familiar with every major area of the Nextedy RISKSHEET interface: the toolbar, column headers, column group headers, the data grid, row headers, hierarchical row levels, context menus, cell editors, filtering controls, and saved views. You will know how to navigate a risk analysis table, identify different column types by their visual cues, understand the hierarchical row structure used for Failure Mode and Effects Analysis (FMEA) and Hazard Analysis and Risk Assessment (HARA) workflows, and perform basic interactions such as editing, sorting, and filtering.
Risksheet is a generic tool that supports any risk management methodology, including FMEA, HARA, Threat Analysis and Risk Assessment (TARA), STRIDE, and Common Vulnerability Scoring System (CVSS) analysis. The examples on this page use FMEA terminology, but the interface concepts apply identically to every methodology.
## Prerequisites
* Risksheet is installed on your Siemens Polarion ALM instance (see [Installation](/risksheet/getting-started/installation))
* You have access to a Polarion project with at least one risksheet document
* You are logged into Polarion with a valid license (see [Evaluate Risksheet](/risksheet/getting-started/evaluation))
If you do not have an existing risksheet document, follow [Evaluate Risksheet](/risksheet/getting-started/evaluation) to set one up before continuing with this tutorial. The recommended approach is to pick the closest Nextedy solution template for your industry and methodology, then adapt it — never start from a blank configuration.
Navigate to your Polarion project and open a LiveDoc document that contains a risksheet. The grid loads within the document page, replacing the standard Polarion table view with an interactive, Excel-like sheet.
You should see the full grid occupying the document area, with a toolbar row above and the data grid below.
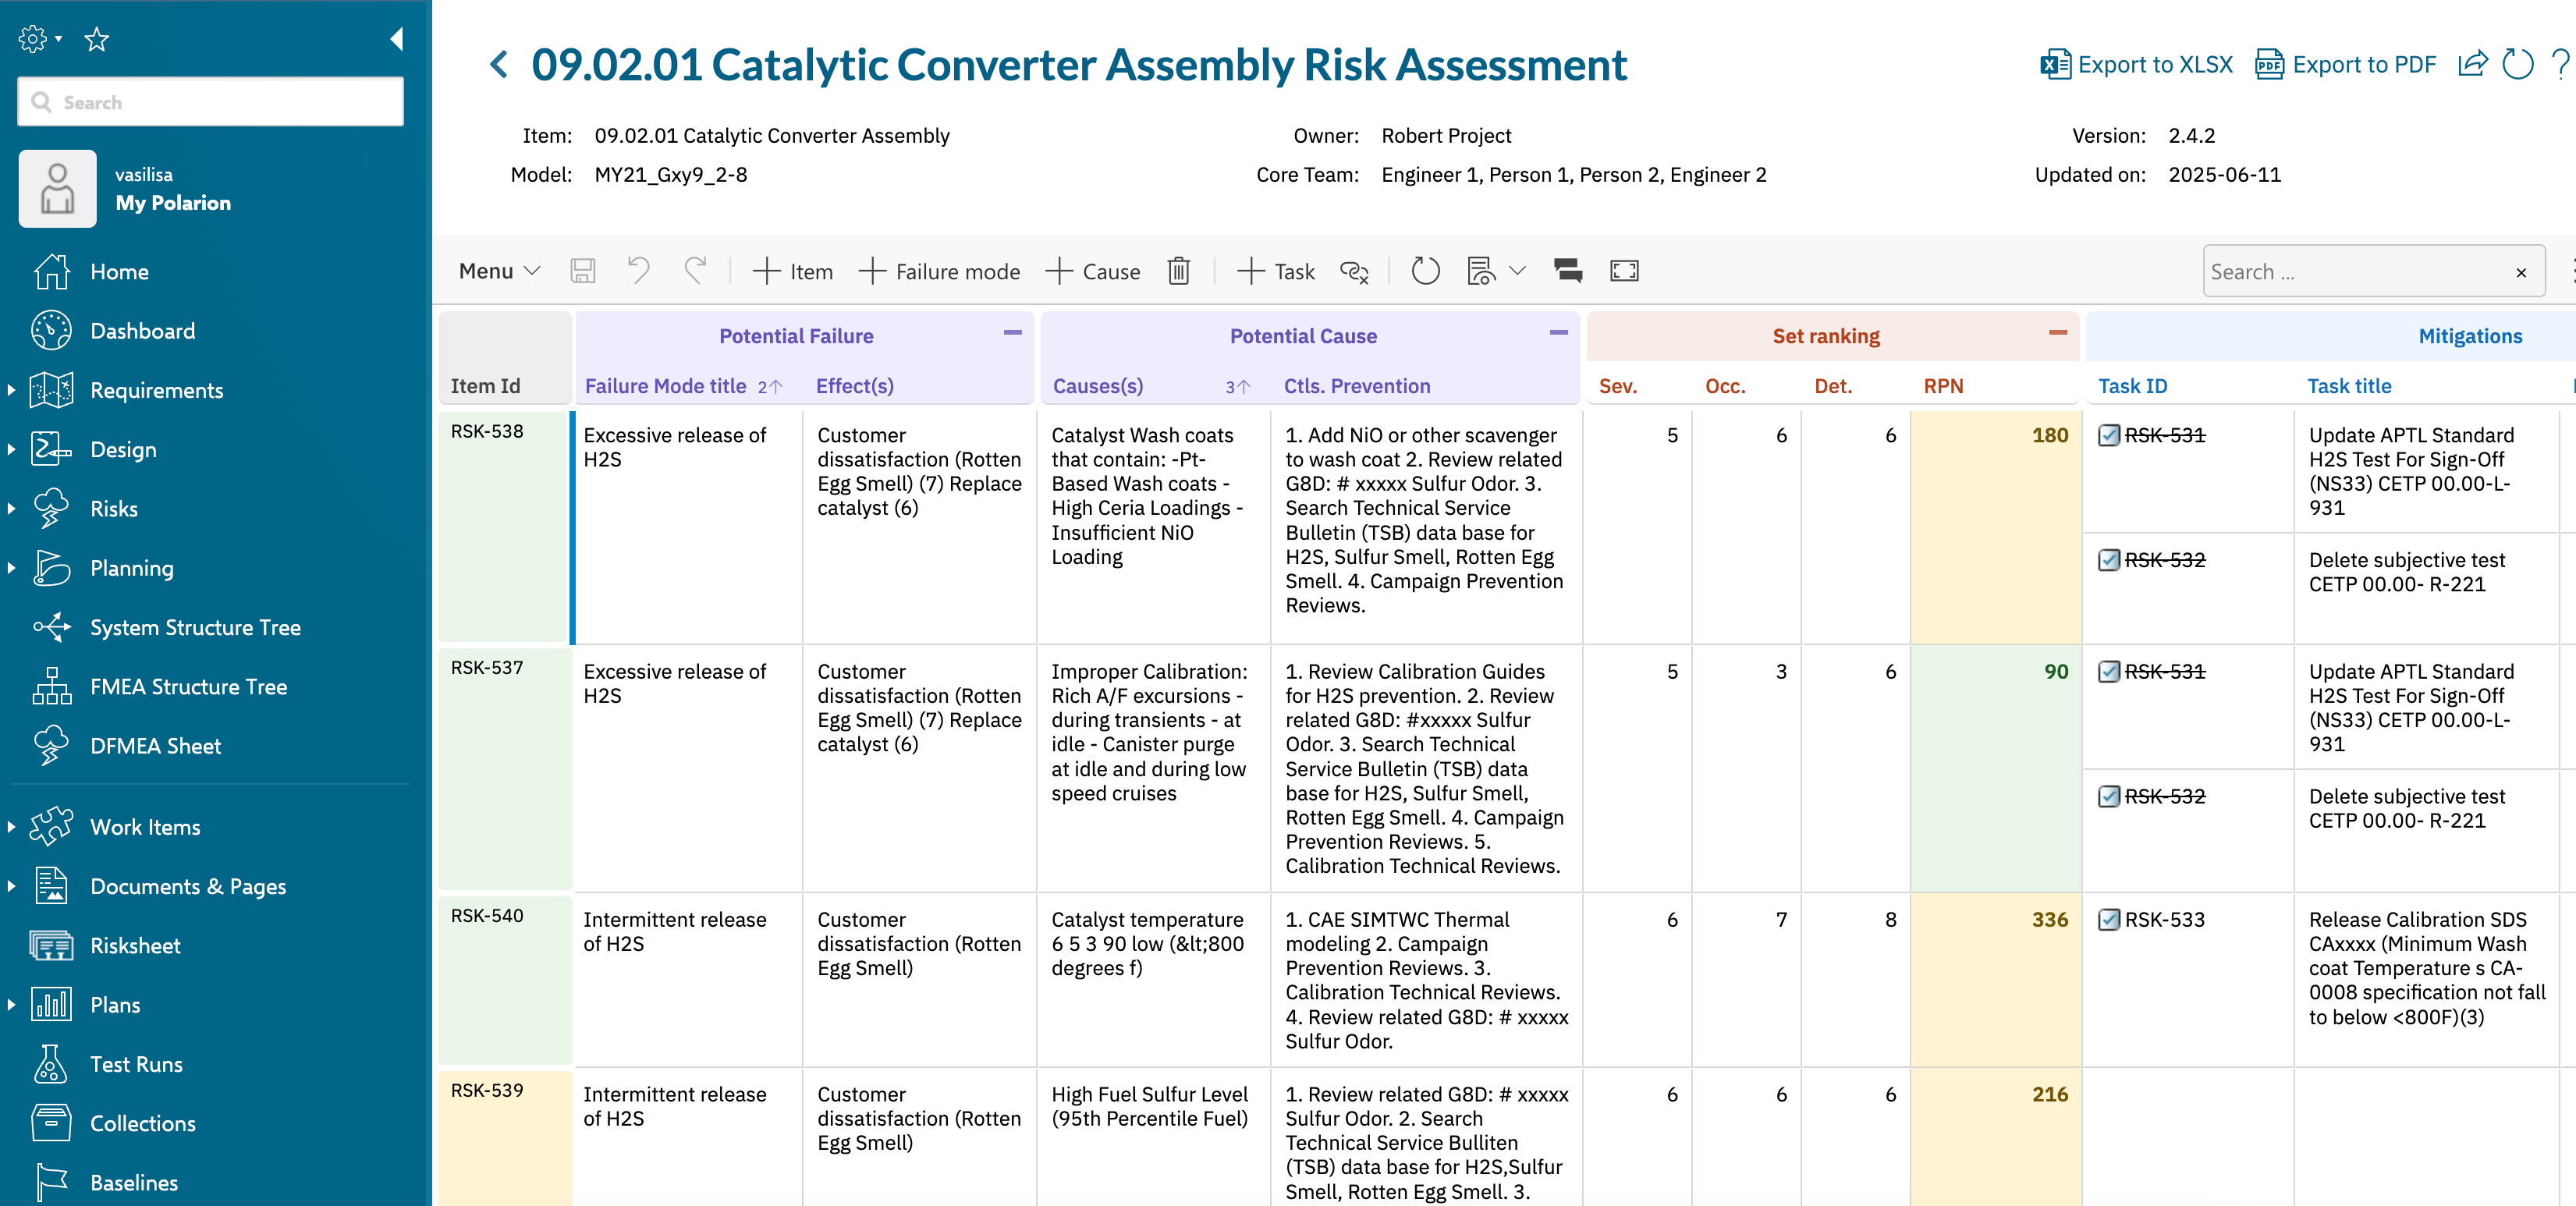 The layout divides into four zones stacked top to bottom: the top panel area, the Risksheet toolbar, the header area (group headers and column headers), and the data grid containing all risk item rows. The Polarion navigation bar is shown on the left. All data shown in the grid lives in Polarion as standard work items — Risksheet does not maintain its own data store. Every change you make is saved as an edit to a Polarion work item, subject to Polarion's authorization rules and traceable through Polarion's audit infrastructure.
The toolbar row sits at the top of the grid. From left to right, it provides buttons for the most common operations:
| Button | Action | Notes |
| ------------------ | ---------------------------------------------- | ----------------------------------------------------------------------------------------------------------------------------------------------------------------------------------------------- |
| **Menu** | Open the Risksheet menu | Hosts configuration, override, and other commands. Configuration is opened via **Menu > Configuration > Edit Risksheet Configuration** (only available to users with administrator permissions) |
| **Save** | Save all pending changes to the server | Batches multiple edits into one save operation |
| **Undo** | Undo the last edit | Client-side undo, works before save |
| **Redo** | Redo an undone edit | Cleared when you make a new edit |
| **+ Item** | Add a new top-level risk item | Adds a row at the highest hierarchy level |
| **+ Failure mode** | Add a new failure mode under the current item | Labels reflect the configured `levels` |
| **+ Cause** | Add a new cause under the current failure mode | Labels reflect the configured `levels` |
| **Delete** | Remove the selected item | Trash icon; clears or deletes the row depending on context |
| **+ Task** | Add a downstream task (mitigation, control) | Label reflects `dataTypes.task.name` |
| **Unlink Task** | Unlink the selected task from the risk | |
| **Refresh** | Reload the grid data from the server | Circular-arrow icon; pulls the latest work item values |
| **Views** | Switch between saved column visibility presets | Only visible if views are configured |
| **Fullscreen** | Expand the grid to fill the browser window | |
| **Search** | Search for any specific data on the Risksheet | |
| **Find & Replace** | Open a sidebar to find and replace the text | |
At the top-right of the toolbar, **Export to XLSX** downloads the current view as an Excel file (respecting column visibility settings) and **Export to PDF** generates a formatted PDF export (configurable through the PDF export configuration).
Hover over each button to see its tooltip description. The toolbar buttons are context-aware: some are disabled when there are no pending changes (Save, Undo, Redo) or when you lack the necessary permissions (configuration access).
Use `Ctrl+S` (or `Cmd+S` on macOS) to save, `Ctrl+Z` to undo, and `Ctrl+Y` to redo. Copy cells with `Ctrl+C` and paste with `Ctrl+V`. These shortcuts work whenever the grid has focus.
Risksheet supports two header rows above the data cells:
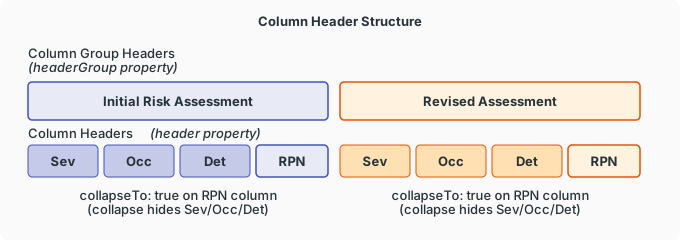
1. **Column group headers** — the top row that spans multiple columns under a shared label (for example, "Initial Risk Assessment" or "Revised Assessment"). These groups are configured via the `headerGroup` property on individual column definitions. The height of this row is set by `headers.columnGroupHeader.height` (default: `32` pixels). Groups can be collapsed to hide their member columns; columns marked with `collapseTo: true` remain visible as a summary when the group collapses.
2. **Column headers** — the row directly above the data cells showing individual column names (for example, "Severity", "Occurrence", "Detection", "RPN"). The height is set by `headers.columnHeader.height` (default: `32` pixels). Each header displays the value from the column's `header` property.
The layout divides into four zones stacked top to bottom: the top panel area, the Risksheet toolbar, the header area (group headers and column headers), and the data grid containing all risk item rows. The Polarion navigation bar is shown on the left. All data shown in the grid lives in Polarion as standard work items — Risksheet does not maintain its own data store. Every change you make is saved as an edit to a Polarion work item, subject to Polarion's authorization rules and traceable through Polarion's audit infrastructure.
The toolbar row sits at the top of the grid. From left to right, it provides buttons for the most common operations:
| Button | Action | Notes |
| ------------------ | ---------------------------------------------- | ----------------------------------------------------------------------------------------------------------------------------------------------------------------------------------------------- |
| **Menu** | Open the Risksheet menu | Hosts configuration, override, and other commands. Configuration is opened via **Menu > Configuration > Edit Risksheet Configuration** (only available to users with administrator permissions) |
| **Save** | Save all pending changes to the server | Batches multiple edits into one save operation |
| **Undo** | Undo the last edit | Client-side undo, works before save |
| **Redo** | Redo an undone edit | Cleared when you make a new edit |
| **+ Item** | Add a new top-level risk item | Adds a row at the highest hierarchy level |
| **+ Failure mode** | Add a new failure mode under the current item | Labels reflect the configured `levels` |
| **+ Cause** | Add a new cause under the current failure mode | Labels reflect the configured `levels` |
| **Delete** | Remove the selected item | Trash icon; clears or deletes the row depending on context |
| **+ Task** | Add a downstream task (mitigation, control) | Label reflects `dataTypes.task.name` |
| **Unlink Task** | Unlink the selected task from the risk | |
| **Refresh** | Reload the grid data from the server | Circular-arrow icon; pulls the latest work item values |
| **Views** | Switch between saved column visibility presets | Only visible if views are configured |
| **Fullscreen** | Expand the grid to fill the browser window | |
| **Search** | Search for any specific data on the Risksheet | |
| **Find & Replace** | Open a sidebar to find and replace the text | |
At the top-right of the toolbar, **Export to XLSX** downloads the current view as an Excel file (respecting column visibility settings) and **Export to PDF** generates a formatted PDF export (configurable through the PDF export configuration).
Hover over each button to see its tooltip description. The toolbar buttons are context-aware: some are disabled when there are no pending changes (Save, Undo, Redo) or when you lack the necessary permissions (configuration access).
Use `Ctrl+S` (or `Cmd+S` on macOS) to save, `Ctrl+Z` to undo, and `Ctrl+Y` to redo. Copy cells with `Ctrl+C` and paste with `Ctrl+V`. These shortcuts work whenever the grid has focus.
Risksheet supports two header rows above the data cells:
1. **Column group headers** — the top row that spans multiple columns under a shared label (for example, "Initial Risk Assessment" or "Revised Assessment"). These groups are configured via the `headerGroup` property on individual column definitions. The height of this row is set by `headers.columnGroupHeader.height` (default: `32` pixels). Groups can be collapsed to hide their member columns; columns marked with `collapseTo: true` remain visible as a summary when the group collapses.
2. **Column headers** — the row directly above the data cells showing individual column names (for example, "Severity", "Occurrence", "Detection", "RPN"). The height is set by `headers.columnHeader.height` (default: `32` pixels). Each header displays the value from the column's `header` property.
 Click a column header to sort the grid by that column. Click again to reverse the sort direction. A third click removes the sort. Sorting is performed entirely client-side, so results appear instantly with no server round-trip.
Click the collapse icon on a column group header to hide grouped columns. The column whose definition includes `collapseTo: true` stays visible as a summary; click the icon again to expand and show all columns.
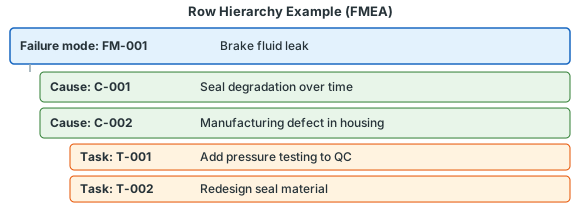
Risksheet creates a visual hierarchy through cell merging, configured by the `levels` array in the sheet configuration. The underlying data model itself has exactly two entity types — risk items and downstream task items — both stored as ordinary Polarion work items. The grid can show three, four, or more visual levels by merging cells that share the same value in a designated control column.
Each entry in the `levels` array requires three properties:
| Property | Type | Purpose |
| --------------- | ------ | ----------------------------------------------------------------------------------------- |
| `name` | string | Display name shown in the navigation and zoom menus (for example, "Item", "Failure mode") |
| `controlColumn` | string | Column ID whose value is used as the grouping key for cell merging |
| `zoomColumn` | string | Column ID used as the target for zoom or drill-down navigation |
A typical FMEA sheet configuration uses three visual levels on the risk side, plus a downstream task entity:
```yaml theme={null}
levels:
- name: Item
controlColumn: item
zoomColumn: item
- name: Failure mode
controlColumn: failureMode
zoomColumn: failureMode
- name: Cause
controlColumn: systemItemId
zoomColumn: causes
dataTypes:
risk:
type: failureMode
task:
type: mitigation
role: mitigates
name: Task
zoomColumn: taskTitle
```
In this example, all risk rows are the same Polarion work item type (`failureMode`). The three visual levels appear purely through cell merging — the "Item" column merges consecutive rows that share the same item, and the "Failure mode" column merges consecutive rows that share the same failure mode. Downstream mitigation tasks are separate Polarion work items configured under `dataTypes.task`.
Click a column header to sort the grid by that column. Click again to reverse the sort direction. A third click removes the sort. Sorting is performed entirely client-side, so results appear instantly with no server round-trip.
Click the collapse icon on a column group header to hide grouped columns. The column whose definition includes `collapseTo: true` stays visible as a summary; click the icon again to expand and show all columns.
Risksheet creates a visual hierarchy through cell merging, configured by the `levels` array in the sheet configuration. The underlying data model itself has exactly two entity types — risk items and downstream task items — both stored as ordinary Polarion work items. The grid can show three, four, or more visual levels by merging cells that share the same value in a designated control column.
Each entry in the `levels` array requires three properties:
| Property | Type | Purpose |
| --------------- | ------ | ----------------------------------------------------------------------------------------- |
| `name` | string | Display name shown in the navigation and zoom menus (for example, "Item", "Failure mode") |
| `controlColumn` | string | Column ID whose value is used as the grouping key for cell merging |
| `zoomColumn` | string | Column ID used as the target for zoom or drill-down navigation |
A typical FMEA sheet configuration uses three visual levels on the risk side, plus a downstream task entity:
```yaml theme={null}
levels:
- name: Item
controlColumn: item
zoomColumn: item
- name: Failure mode
controlColumn: failureMode
zoomColumn: failureMode
- name: Cause
controlColumn: systemItemId
zoomColumn: causes
dataTypes:
risk:
type: failureMode
task:
type: mitigation
role: mitigates
name: Task
zoomColumn: taskTitle
```
In this example, all risk rows are the same Polarion work item type (`failureMode`). The three visual levels appear purely through cell merging — the "Item" column merges consecutive rows that share the same item, and the "Failure mode" column merges consecutive rows that share the same failure mode. Downstream mitigation tasks are separate Polarion work items configured under `dataTypes.task`.
 The **row header** column appears on the left side of the grid. It displays the work item ID and can show conditional color coding based on risk values. For example, the `headers.rowHeader.renderer` property names a cell decorator function (defined in the `cellDecorators` section) that color-codes row headers based on the revised RPN value, giving you an at-a-glance risk summary.
Click any editable cell in the grid to enter edit mode. The cell editor that appears depends on the column `type` configured in the sheet configuration:
| Column Type | Editor | Behavior |
| -------------------------- | ------------------------------ | ------------------------------------------------------------------------------------------------------------- |
| `text` | Multi-line text input | Free-form text |
| `enum:`, `rating:` | Dropdown selector | Shows values from the referenced Polarion enumeration; can show descriptions when `showEnumDescription: true` |
| `multiEnum:` | Multi-select checkbox dropdown | Shows up to 2 selections, then "+N more" |
| `boolean` | Checkbox toggle | Click to toggle true/false |
| `date` | Date picker | Stores as `YYYY-MM-DD` |
| `datetime` | Date-time picker | Stores as ISO datetime |
| `int`, `float`, `currency` | Numeric input | Validates numeric entry |
| `itemLink` | Link picker with search | Browse or create linked work items |
| `multiItemLink` | Multi-link picker | Link to multiple work items |
| `taskLink` | Task link picker | Link or create downstream task items |
Severity, occurrence, and detection scales are not defined inside the sheet configuration. They are Polarion enumerations defined once in **Administration > Enumerations** and referenced from a column via `type: rating:` plus `bindings: `. The server loads the available values automatically.
After editing, your change is held in memory until you click **Save** or press `Ctrl+S`. Risksheet batches multiple edits and sends them to the server together, so you can make several changes before saving. The toolbar Save button shows an indicator when there are unsaved changes.
Some cells cannot be edited. Cells with a `formula` (calculated columns), a `serverRender` script, or that reference system fields such as `id`, `type`, `project`, `created`, `updated`, or `outlineNumber` are automatically read-only. Columns explicitly marked with `readOnly: true`, and any grid viewing a historical revision (not the current head), are also read-only. Read-only cells display a visual indicator when you attempt to click them.
Right-click any row to open the context menu. The menu provides row-level operations:
| Menu Item | Action | Availability |
| --------------------- | --------------------------------------------------------------- | ------------------------------------------------------------- |
| **Open Row Item** | Opens the work item in the standard Polarion editor | Always available |
| **Open Linked Item** | Opens a linked work item from an item link or task column | When the cell contains a valid item link |
| **New \[Level] Item** | Creates a new work item at the specified hierarchy level | When `levels[].showInMenu` is `true` and the grid is editable |
| **New Task** | Creates a downstream mitigation task linked to the selected row | When the `dataTypes.task` configuration allows task creation |
| **Remove Row Item** | Removes the selected item from the grid | In editable grids only |
| **Freeze Pane** | Freezes columns to the left for horizontal scrolling | Always available |
| **Unfreeze Pane** | Removes column freezing | When columns are currently frozen |
The available menu items depend on the row's hierarchical level, the `dataTypes` configuration, and your Polarion user permissions. Custom context menu actions can also be added through the configuration's extensibility points.
Risksheet supports column-level filtering for any column where `filterable` is set to `true` (the default). Click the filter icon in a column header to open the filter panel, then select or deselect values to narrow the displayed rows.
Filtering is performed client-side, so results appear instantly. You can apply filters to multiple columns simultaneously. Filtered rows are hidden from view but not removed from the data — clearing the filter restores all rows.
The **row header** column appears on the left side of the grid. It displays the work item ID and can show conditional color coding based on risk values. For example, the `headers.rowHeader.renderer` property names a cell decorator function (defined in the `cellDecorators` section) that color-codes row headers based on the revised RPN value, giving you an at-a-glance risk summary.
Click any editable cell in the grid to enter edit mode. The cell editor that appears depends on the column `type` configured in the sheet configuration:
| Column Type | Editor | Behavior |
| -------------------------- | ------------------------------ | ------------------------------------------------------------------------------------------------------------- |
| `text` | Multi-line text input | Free-form text |
| `enum:`, `rating:` | Dropdown selector | Shows values from the referenced Polarion enumeration; can show descriptions when `showEnumDescription: true` |
| `multiEnum:` | Multi-select checkbox dropdown | Shows up to 2 selections, then "+N more" |
| `boolean` | Checkbox toggle | Click to toggle true/false |
| `date` | Date picker | Stores as `YYYY-MM-DD` |
| `datetime` | Date-time picker | Stores as ISO datetime |
| `int`, `float`, `currency` | Numeric input | Validates numeric entry |
| `itemLink` | Link picker with search | Browse or create linked work items |
| `multiItemLink` | Multi-link picker | Link to multiple work items |
| `taskLink` | Task link picker | Link or create downstream task items |
Severity, occurrence, and detection scales are not defined inside the sheet configuration. They are Polarion enumerations defined once in **Administration > Enumerations** and referenced from a column via `type: rating:` plus `bindings: `. The server loads the available values automatically.
After editing, your change is held in memory until you click **Save** or press `Ctrl+S`. Risksheet batches multiple edits and sends them to the server together, so you can make several changes before saving. The toolbar Save button shows an indicator when there are unsaved changes.
Some cells cannot be edited. Cells with a `formula` (calculated columns), a `serverRender` script, or that reference system fields such as `id`, `type`, `project`, `created`, `updated`, or `outlineNumber` are automatically read-only. Columns explicitly marked with `readOnly: true`, and any grid viewing a historical revision (not the current head), are also read-only. Read-only cells display a visual indicator when you attempt to click them.
Right-click any row to open the context menu. The menu provides row-level operations:
| Menu Item | Action | Availability |
| --------------------- | --------------------------------------------------------------- | ------------------------------------------------------------- |
| **Open Row Item** | Opens the work item in the standard Polarion editor | Always available |
| **Open Linked Item** | Opens a linked work item from an item link or task column | When the cell contains a valid item link |
| **New \[Level] Item** | Creates a new work item at the specified hierarchy level | When `levels[].showInMenu` is `true` and the grid is editable |
| **New Task** | Creates a downstream mitigation task linked to the selected row | When the `dataTypes.task` configuration allows task creation |
| **Remove Row Item** | Removes the selected item from the grid | In editable grids only |
| **Freeze Pane** | Freezes columns to the left for horizontal scrolling | Always available |
| **Unfreeze Pane** | Removes column freezing | When columns are currently frozen |
The available menu items depend on the row's hierarchical level, the `dataTypes` configuration, and your Polarion user permissions. Custom context menu actions can also be added through the configuration's extensibility points.
Risksheet supports column-level filtering for any column where `filterable` is set to `true` (the default). Click the filter icon in a column header to open the filter panel, then select or deselect values to narrow the displayed rows.
Filtering is performed client-side, so results appear instantly. You can apply filters to multiple columns simultaneously. Filtered rows are hidden from view but not removed from the data — clearing the filter restores all rows.
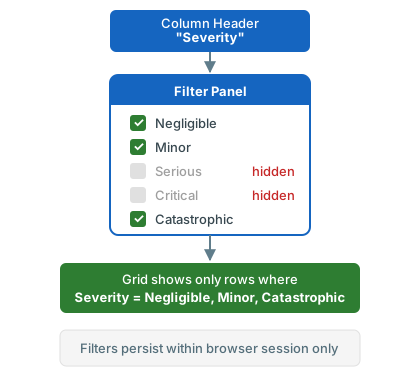 Filters persist within your browser session but are not saved across page reloads. Filters are applied on the client and do not affect other users viewing the same document.
If your sheet configuration includes saved views (defined in the `views` array), use the **Views** dropdown in the toolbar to switch between different column visibility presets. Each view shows a different subset of columns, allowing you to focus on specific aspects of the analysis without scrolling through all columns.
A view is defined by its `name` and a `columnIds` array listing the columns to show. The special value `@all` includes every column, and a `-` prefix excludes a specific column from the set. One view per configuration may be marked `defaultView: true` to load automatically when the document is opened.
```yaml theme={null}
views:
- name: Full FMEA
defaultView: true
columnIds:
- "@all"
- name: Risk Summary
columnIds:
- failureMode
- rpn
- status
- name: Mitigation Tracking
columnIds:
- "@all"
- "-initialAssessment"
```
Common view configurations include:
| View Name | Columns Shown | Use Case |
| ------------------- | ----------------------------------------------------------------- | ----------------------------- |
| Full FMEA | All columns visible | Comprehensive analysis review |
| Risk Summary | Failure mode, RPN, status | Management reporting |
| Mitigation Tracking | Mitigation actions, assignee, due date, status | Action item follow-up |
| Initial vs. Revised | Severity, occurrence, detection, RPN for both initial and revised | Before/after comparison |
You can also reset your personal column width and visibility customizations back to the configuration default using the reset columns command.
## Next Steps
Now that you understand the interface layout and basic interactions, continue with these tutorials:
* [Basic Configuration](/risksheet/getting-started/basic-configuration) — learn how to customize the sheet configuration
* [How-To Guides](/risksheet/guides/index) — task-oriented guides for specific workflows such as column configuration, export, and review management
* [Concepts](/risksheet/concepts/index) — deeper explanations of architecture, data model, and traceability
Filters persist within your browser session but are not saved across page reloads. Filters are applied on the client and do not affect other users viewing the same document.
If your sheet configuration includes saved views (defined in the `views` array), use the **Views** dropdown in the toolbar to switch between different column visibility presets. Each view shows a different subset of columns, allowing you to focus on specific aspects of the analysis without scrolling through all columns.
A view is defined by its `name` and a `columnIds` array listing the columns to show. The special value `@all` includes every column, and a `-` prefix excludes a specific column from the set. One view per configuration may be marked `defaultView: true` to load automatically when the document is opened.
```yaml theme={null}
views:
- name: Full FMEA
defaultView: true
columnIds:
- "@all"
- name: Risk Summary
columnIds:
- failureMode
- rpn
- status
- name: Mitigation Tracking
columnIds:
- "@all"
- "-initialAssessment"
```
Common view configurations include:
| View Name | Columns Shown | Use Case |
| ------------------- | ----------------------------------------------------------------- | ----------------------------- |
| Full FMEA | All columns visible | Comprehensive analysis review |
| Risk Summary | Failure mode, RPN, status | Management reporting |
| Mitigation Tracking | Mitigation actions, assignee, due date, status | Action item follow-up |
| Initial vs. Revised | Severity, occurrence, detection, RPN for both initial and revised | Before/after comparison |
You can also reset your personal column width and visibility customizations back to the configuration default using the reset columns command.
## Next Steps
Now that you understand the interface layout and basic interactions, continue with these tutorials:
* [Basic Configuration](/risksheet/getting-started/basic-configuration) — learn how to customize the sheet configuration
* [How-To Guides](/risksheet/guides/index) — task-oriented guides for specific workflows such as column configuration, export, and review management
* [Concepts](/risksheet/concepts/index) — deeper explanations of architecture, data model, and traceability