> ## Documentation Index
> Fetch the complete documentation index at: https://learn.nextedy.com/llms.txt
> Use this file to discover all available pages before exploring further.
# Customize Capacity Indicators
> Adjust how capacity bars and capacity tooltips appear on the Nextedy PLANNINGBOARD so your team can quickly assess load at a glance.
## Prerequisites
Before customizing capacity indicators, ensure you have:
* Capacity tracking enabled on the widget (set `capacityLoad = true` in widget parameters — see [Configure Capacity Tracking](/planningboard/guides/configuration/capacity-configuration))
* At least one Plan with work items assigned to swimlanes
* Widget editor access to the Polarion page hosting the Planningboard
***
## How capacity indicators work
Each column (Plan) on the Planningboard displays a **capacity bar** in the column header when `capacityLoad` is enabled. The bar shows the ratio of allocated effort to the Plan's total capacity. When you hover over the bar, a tooltip shows the breakdown.
 ***
Planningboard supports three capacity modes, controlled by widget parameters:
| Parameter | Type | Default | Effect |
| ------------------- | ------- | -------- | ----------------------------------------------------------------------------------------------------------------------------- |
| `capacityLoad` | boolean | `false` | Enables column-level capacity bars |
| `multiCapacityLoad` | boolean | `false` | Enables per-swimlane (per-resource) capacity bars |
| `userCapacityLoad` | boolean | `false` | Enables per-user capacity when the Teams service is active |
| `capacityField` | string | *(none)* | Custom field ID supplying capacity values (e.g. story points); falls back to `remainingEstimate`/`initialEstimate` when unset |
| `hoursPerDay` | number | `8` | Conversion factor for time-based effort to daily hours |
Enable the mode that fits your planning context:
* **Column-level only** — set `capacityLoad = true`. A single bar per Plan column shows total load.
* **Per-resource bars** — set both `capacityLoad = true` and `multiCapacityLoad = true`. Each swimlane cell shows its own bar.
* **Per-user capacity with Teams service** — set `capacityLoad = true` and `userCapacityLoad = true` (requires `useTeamsService = true`).
Capacity configuration parameter values are whitespace-sensitive. Do not add trailing spaces after boolean values such as `true` or `false` in widget parameter fields — they may silently disable the feature.
***
By default, Planningboard derives effort from the work item's `remainingEstimate` and `initialEstimate` time-tracking fields, converting them using `hoursPerDay`.
To use a custom numeric field (for example, story points stored in a field called `storyPoints`):
1. Open the widget parameters for your Planningboard.
2. Set `capacityField = storyPoints` (use the exact Polarion field ID, matching case).
3. Ensure the field is populated on your work items before opening the board.
When using `capacityField`, the `hoursPerDay` conversion is applied to translate the field value into hours for capacity calculations. If your field already stores hours, set `hoursPerDay = 1` to avoid double conversion.
***
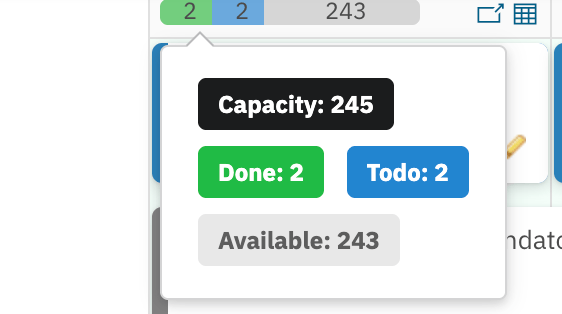
By default, hovering over a capacity bar shows aggregate values: **Capacity**, **Done**, **Todo**, and **Available**.
You can replace this with a custom tooltip template using the `columnTooltipTemplate` configuration option. This is configured via a **Config Script** in the widget's Advanced Properties section.
### Default tooltip (no template configured)
```text theme={null}
Capacity: 40 h
Done: 10 h
Todo: 22 h
Available: 8 h
```
***
Planningboard supports three capacity modes, controlled by widget parameters:
| Parameter | Type | Default | Effect |
| ------------------- | ------- | -------- | ----------------------------------------------------------------------------------------------------------------------------- |
| `capacityLoad` | boolean | `false` | Enables column-level capacity bars |
| `multiCapacityLoad` | boolean | `false` | Enables per-swimlane (per-resource) capacity bars |
| `userCapacityLoad` | boolean | `false` | Enables per-user capacity when the Teams service is active |
| `capacityField` | string | *(none)* | Custom field ID supplying capacity values (e.g. story points); falls back to `remainingEstimate`/`initialEstimate` when unset |
| `hoursPerDay` | number | `8` | Conversion factor for time-based effort to daily hours |
Enable the mode that fits your planning context:
* **Column-level only** — set `capacityLoad = true`. A single bar per Plan column shows total load.
* **Per-resource bars** — set both `capacityLoad = true` and `multiCapacityLoad = true`. Each swimlane cell shows its own bar.
* **Per-user capacity with Teams service** — set `capacityLoad = true` and `userCapacityLoad = true` (requires `useTeamsService = true`).
Capacity configuration parameter values are whitespace-sensitive. Do not add trailing spaces after boolean values such as `true` or `false` in widget parameter fields — they may silently disable the feature.
***
By default, Planningboard derives effort from the work item's `remainingEstimate` and `initialEstimate` time-tracking fields, converting them using `hoursPerDay`.
To use a custom numeric field (for example, story points stored in a field called `storyPoints`):
1. Open the widget parameters for your Planningboard.
2. Set `capacityField = storyPoints` (use the exact Polarion field ID, matching case).
3. Ensure the field is populated on your work items before opening the board.
When using `capacityField`, the `hoursPerDay` conversion is applied to translate the field value into hours for capacity calculations. If your field already stores hours, set `hoursPerDay = 1` to avoid double conversion.
***
By default, hovering over a capacity bar shows aggregate values: **Capacity**, **Done**, **Todo**, and **Available**.
You can replace this with a custom tooltip template using the `columnTooltipTemplate` configuration option. This is configured via a **Config Script** in the widget's Advanced Properties section.
### Default tooltip (no template configured)
```text theme={null}
Capacity: 40 h
Done: 10 h
Todo: 22 h
Available: 8 h
```
 ### Custom tooltip with per-user breakdown
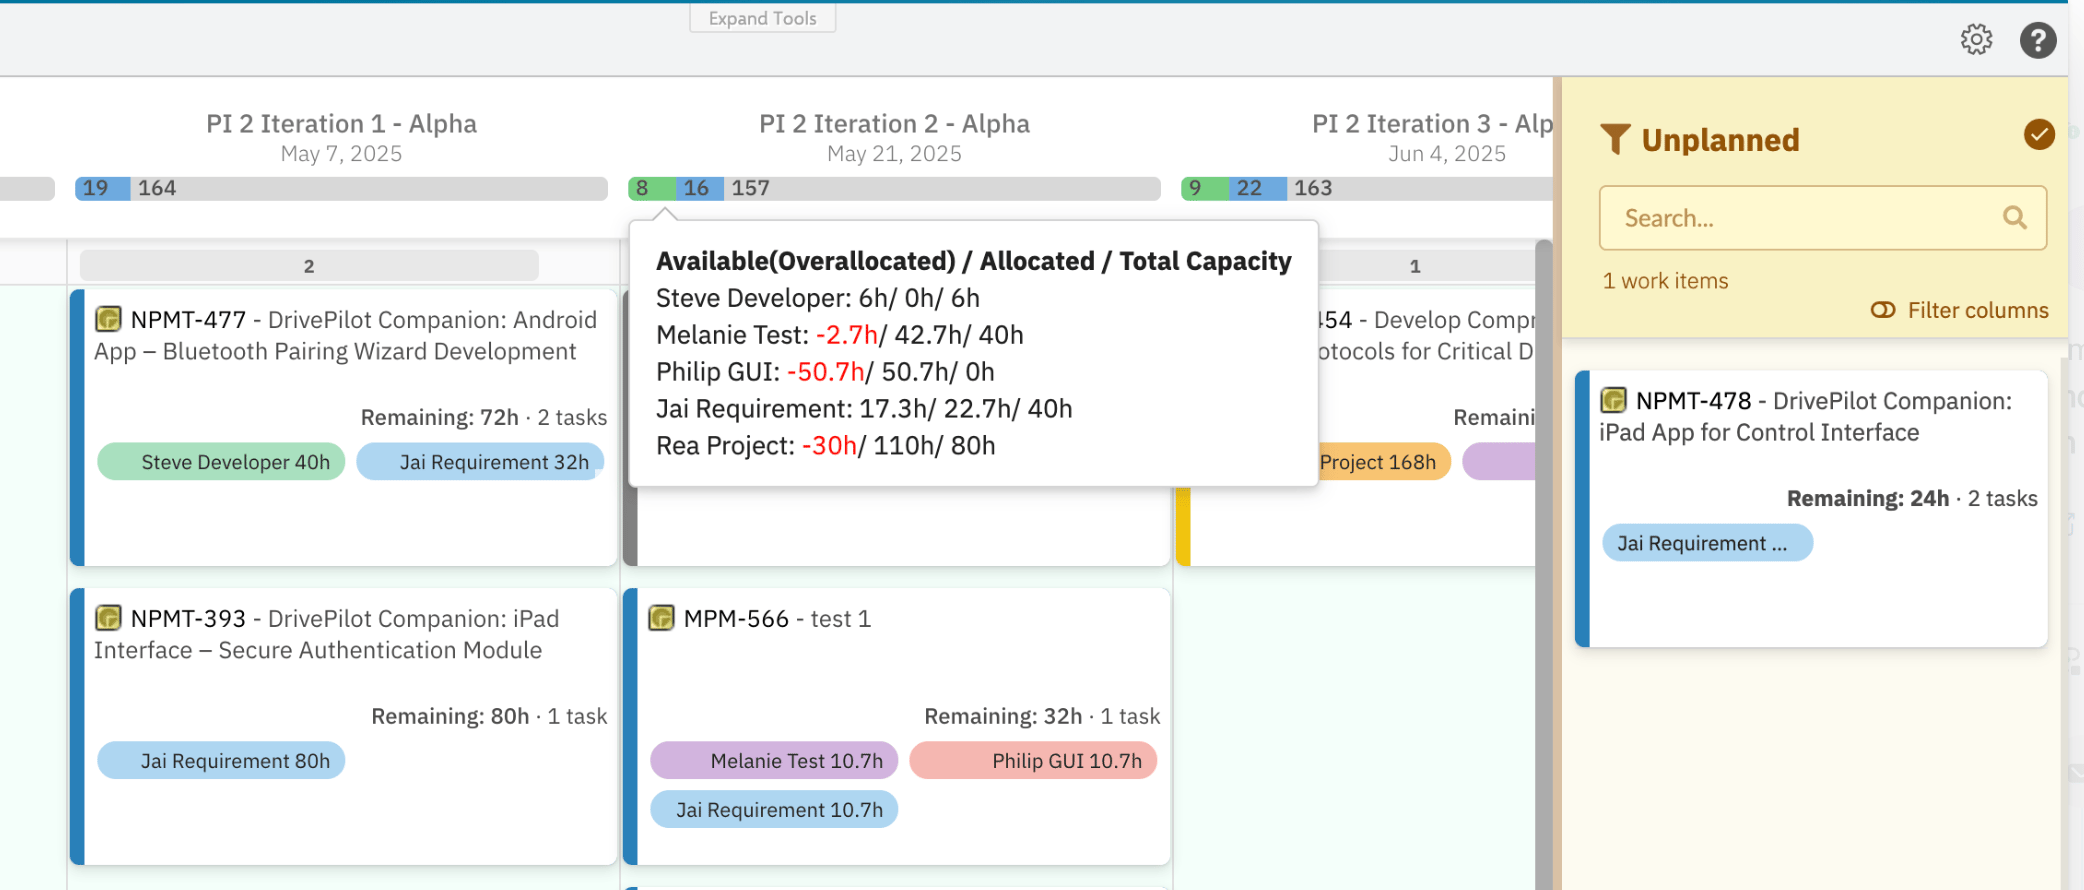
The `columnTooltipTemplate` accepts either a static string template or a JavaScript function receiving the column and row objects. The following example adds a per-user allocation breakdown with overallocation highlighting:
```javascript theme={null}
scheduler.columnTooltipTemplate = function(column, row) {
var lines = "" + column.text + "
### Custom tooltip with per-user breakdown
The `columnTooltipTemplate` accepts either a static string template or a JavaScript function receiving the column and row objects. The following example adds a per-user allocation breakdown with overallocation highlighting:
```javascript theme={null}
scheduler.columnTooltipTemplate = function(column, row) {
var lines = "" + column.text + "
";
if (column.users) {
column.users.forEach(function(user) {
var available = user.capacity - user.allocated;
var style = available < 0 ? "color:red;" : "";
lines += user.name + ": "
+ "" + available + ""
+ " / " + user.allocated
+ " / " + user.capacity + " h
";
});
}
return lines;
};
scheduler.setCurrentView();
```
After setting or changing `columnTooltipTemplate` programmatically, call `scheduler.setCurrentView()` to trigger a re-render. Without it, the board continues to show the previous tooltip until the next natural refresh.
The tooltip is attached to the `.capacityLoad` element on each Plan column (`.plan[data-col-id]`). The HTML rendered by your template is stored in the `data-html` attribute of that element and shown on hover.
***
Beyond column capacity bars, Planningboard has a **Toggle Resource Load visualization** control in the toolbar. When active, it shows the current load of each assignee directly in the swimlanes.
To enable it:
1. Open the board.
2. Click the **Toggle Resource Load visualization** button in the upper-left toolbar.
This is a per-session toggle — it does not require widget parameter changes.
 ***
## Capacity indicator layout reference
***
## Capacity indicator layout reference
 ***
## Common pitfalls
If no capacity bar is shown despite `capacityLoad = true`, verify that:
* The Plans on the board have a capacity value set in Polarion.
* The `capacityField` value (if set) matches an existing, populated field ID exactly — field IDs are case-sensitive.
* There are no trailing spaces in parameter values (whitespace sensitivity applies).
`multiCapacityLoad` requires `capacityLoad` to also be `true`. Setting only `multiCapacityLoad = true` without the base `capacityLoad` flag does not activate capacity bars.
If you change `columnTooltipTemplate` in a Config Script, you must call `scheduler.setCurrentView()` at the end of the script. Without this call, the board re-renders on the next data refresh, not immediately.
In a custom tooltip template, available capacity is negative when a resource is overallocated. Display it in red (e.g. `style={{color: "red"}}`) to make overallocation visible at a glance — this mirrors the built-in overallocation visualization behavior.
***
## Limitations
* **No multi-assignee effort distribution:** When a work item has multiple assignees, Planningboard does not split its effort across them. The full effort is attributed to the primary resource. This is a known gap relative to Nextedy GANTT.
* **No sub-item effort rollup:** Effort on child work items is not automatically aggregated into a parent's capacity contribution on the board.
* **Swimlane sort order is coupled to item sort order:** You cannot sort swimlane rows by capacity independently of the item sort order.
***
## Verification
After applying your changes, refresh the Planningboard. You should now see:
* A colored bar in each Plan column header when `capacityLoad` is enabled.
* Per-swimlane bars in each cell when `multiCapacityLoad` is also enabled.
* The customized tooltip content when hovering over any capacity bar.
If the bars are missing, review the pitfalls above and check [Capacity Calculation Issues](/planningboard/guides/troubleshooting/capacity-issues).
***
## See also
* [Configure Capacity Tracking](/planningboard/guides/configuration/capacity-configuration) — enable and wire up capacity parameters
* [Visualize Capacity Load](/planningboard/guides/capacity/capacity-visualization) — understand what the capacity bar values represent
* [Normalize Capacity Across Swimlanes](/planningboard/guides/capacity/capacity-normalization) — balance capacity display across uneven swimlanes
* [Track Team Capacity](/planningboard/guides/capacity/team-capacity) — team-level capacity with the Teams service
* [Configure Multi-Dimensional Capacity](/planningboard/guides/capacity/multi-capacity) — advanced multi-capacity setup
* [Troubleshoot Capacity Calculation Issues](/planningboard/guides/troubleshooting/capacity-issues)
**KB Articles**
* Planningboard: Customizable Statistics and Capacity Indicators
* Customize the content of the card
* Planningboard interface & basic interactions
**Support Tickets**
* [#6679](https://support.nextedy.com/helpdesk/tickets/6679)
* [#6612](https://support.nextedy.com/helpdesk/tickets/6612)
* [#6523](https://support.nextedy.com/helpdesk/tickets/6523)
**Source Code**
* `Config.java`
* `viewLicense.vm`
* `capacityTooltipRendering.cy.ts`
* `PlanningBoardDataService.java`
* `planningboard.js`
***
## Common pitfalls
If no capacity bar is shown despite `capacityLoad = true`, verify that:
* The Plans on the board have a capacity value set in Polarion.
* The `capacityField` value (if set) matches an existing, populated field ID exactly — field IDs are case-sensitive.
* There are no trailing spaces in parameter values (whitespace sensitivity applies).
`multiCapacityLoad` requires `capacityLoad` to also be `true`. Setting only `multiCapacityLoad = true` without the base `capacityLoad` flag does not activate capacity bars.
If you change `columnTooltipTemplate` in a Config Script, you must call `scheduler.setCurrentView()` at the end of the script. Without this call, the board re-renders on the next data refresh, not immediately.
In a custom tooltip template, available capacity is negative when a resource is overallocated. Display it in red (e.g. `style={{color: "red"}}`) to make overallocation visible at a glance — this mirrors the built-in overallocation visualization behavior.
***
## Limitations
* **No multi-assignee effort distribution:** When a work item has multiple assignees, Planningboard does not split its effort across them. The full effort is attributed to the primary resource. This is a known gap relative to Nextedy GANTT.
* **No sub-item effort rollup:** Effort on child work items is not automatically aggregated into a parent's capacity contribution on the board.
* **Swimlane sort order is coupled to item sort order:** You cannot sort swimlane rows by capacity independently of the item sort order.
***
## Verification
After applying your changes, refresh the Planningboard. You should now see:
* A colored bar in each Plan column header when `capacityLoad` is enabled.
* Per-swimlane bars in each cell when `multiCapacityLoad` is also enabled.
* The customized tooltip content when hovering over any capacity bar.
If the bars are missing, review the pitfalls above and check [Capacity Calculation Issues](/planningboard/guides/troubleshooting/capacity-issues).
***
## See also
* [Configure Capacity Tracking](/planningboard/guides/configuration/capacity-configuration) — enable and wire up capacity parameters
* [Visualize Capacity Load](/planningboard/guides/capacity/capacity-visualization) — understand what the capacity bar values represent
* [Normalize Capacity Across Swimlanes](/planningboard/guides/capacity/capacity-normalization) — balance capacity display across uneven swimlanes
* [Track Team Capacity](/planningboard/guides/capacity/team-capacity) — team-level capacity with the Teams service
* [Configure Multi-Dimensional Capacity](/planningboard/guides/capacity/multi-capacity) — advanced multi-capacity setup
* [Troubleshoot Capacity Calculation Issues](/planningboard/guides/troubleshooting/capacity-issues)
**KB Articles**
* Planningboard: Customizable Statistics and Capacity Indicators
* Customize the content of the card
* Planningboard interface & basic interactions
**Support Tickets**
* [#6679](https://support.nextedy.com/helpdesk/tickets/6679)
* [#6612](https://support.nextedy.com/helpdesk/tickets/6612)
* [#6523](https://support.nextedy.com/helpdesk/tickets/6523)
**Source Code**
* `Config.java`
* `viewLicense.vm`
* `capacityTooltipRendering.cy.ts`
* `PlanningBoardDataService.java`
* `planningboard.js`