> ## Documentation Index
> Fetch the complete documentation index at: https://learn.nextedy.com/llms.txt
> Use this file to discover all available pages before exploring further.
# Visualize Capacity Load
> Learn how to display capacity bars and per-user load indicators on the Nextedy PLANNINGBOARD so your team can spot overallocation at a glance during sprint and release planning.
## Prerequisites
Before enabling capacity visualization, ensure the following are in place:
* The Teams Service is configured and your project has at least one team with members and a calendar. See [Set Up Teams Service](/planningboard/guides/capacity/teams-service-setup).
* Team members have remaining estimates on their assigned work items.
* You have access to edit the widget parameters on your Planningboard page.
## How Capacity Is Calculated
Planningboard computes capacity from two sources:
| Source | What it provides |
| ----------------------------- | ----------------------------------------------------------------------------------- |
| Team calendar | Total available hours per user for the Plan period (`totalCapacity`) |
| Work item remaining estimates | Sum of remaining estimates assigned to a user within the Plan (`allocatedCapacity`) |
The formula applied per user:
```text theme={null}
availableCapacity = totalCapacity - allocatedCapacity
```
Negative `availableCapacity` means the user is overallocated. Users without a team calendar entry default to `totalCapacity = 0.0`, which causes them to appear immediately overallocated if any work is assigned.
## Capacity Visualization Modes
Planningboard supports three capacity visualization modes, controlled by widget parameters:
| Parameter | Type | Default | Purpose |
| ------------------- | ------- | ------- | ----------------------------------------------------------------- |
| `capacityLoad` | boolean | `false` | Shows aggregate capacity progress bar per Plan column |
| `userCapacityLoad` | boolean | `false` | Shows per-user capacity in summary cells (requires Teams Service) |
| `multiCapacityLoad` | boolean | `false` | Shows per-resource capacity in each swimlane cell |
You can enable these modes individually or in combination. Note that `multiCapacityLoad` requires `capacityLoad` to also be `true` — it does not take effect on its own.
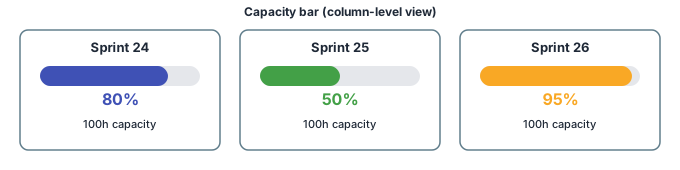
Column-level capacity bars show the aggregate load across all users for each Plan column. This is the simplest mode and requires no Teams Service.
1. Open the Polarion page that contains your Planningboard widget.
2. Click **Edit** to enter page editing mode.
3. Open the widget parameters editor for your Planningboard widget.
4. Set the `capacityLoad` parameter to `true`.
5. Set the `capacityField` parameter if your team tracks effort in a custom field (for example, story points). Leave it blank to use Polarion's built-in `remainingEstimate` / `initialEstimate` fields.
6. Set `hoursPerDay` to the number of working hours per day used in calculations (default: `8`).
7. Save the page.
 If your work items carry story points in a custom field (for example `storyPoints`), set `capacityField = storyPoints`. Planningboard will sum that field instead of time estimates. Combine with a matching `hoursPerDay` conversion only when mixing time-based and point-based effort.
Per-user capacity shows each team member's individual allocation and remaining capacity in summary cells on the board. This mode requires the Teams Service and `assignmentMode = ASSIGNEE`.
1. Confirm that `useTeamsService` is set to `true` in your widget parameters.
2. Set `selectedTeam` to the ID of the team you want to display capacity for.
3. Set `userCapacityLoad` to `true`.
4. Save the page.
When configured, the board displays a summary cell per user row. Each summary cell shows:
* **Allocated** — sum of remaining estimates for tasks assigned to that user in the Plan
* **Total** — user's total available hours from the team calendar
* **Available** — total minus allocated (shown in red if negative)
If a team member has no calendar entry in the Teams Service, their `totalCapacity` defaults to `0.0`. Any assigned work immediately flags them as overallocated. Verify calendar coverage in the Teams Service before relying on per-user capacity numbers.
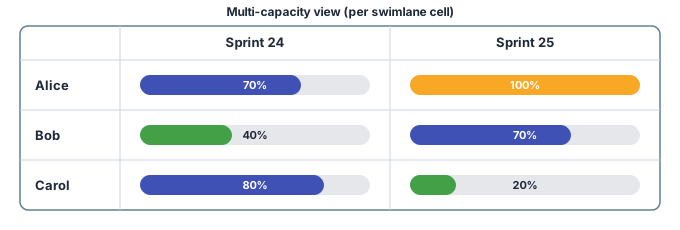
Multi-capacity mode shows a capacity progress bar in each individual swimlane cell — useful when different resources have significantly different capacities.
1. Ensure `capacityLoad` is set to `true` — `multiCapacityLoad` takes effect only when `capacityLoad` is also enabled.
2. Set `multiCapacityLoad` to `true` in the widget parameters.
3. Ensure `useTeamsService` is `true` (multi-capacity reads per-resource capacity from the Teams Service data).
4. Save the page.
If your work items carry story points in a custom field (for example `storyPoints`), set `capacityField = storyPoints`. Planningboard will sum that field instead of time estimates. Combine with a matching `hoursPerDay` conversion only when mixing time-based and point-based effort.
Per-user capacity shows each team member's individual allocation and remaining capacity in summary cells on the board. This mode requires the Teams Service and `assignmentMode = ASSIGNEE`.
1. Confirm that `useTeamsService` is set to `true` in your widget parameters.
2. Set `selectedTeam` to the ID of the team you want to display capacity for.
3. Set `userCapacityLoad` to `true`.
4. Save the page.
When configured, the board displays a summary cell per user row. Each summary cell shows:
* **Allocated** — sum of remaining estimates for tasks assigned to that user in the Plan
* **Total** — user's total available hours from the team calendar
* **Available** — total minus allocated (shown in red if negative)
If a team member has no calendar entry in the Teams Service, their `totalCapacity` defaults to `0.0`. Any assigned work immediately flags them as overallocated. Verify calendar coverage in the Teams Service before relying on per-user capacity numbers.
Multi-capacity mode shows a capacity progress bar in each individual swimlane cell — useful when different resources have significantly different capacities.
1. Ensure `capacityLoad` is set to `true` — `multiCapacityLoad` takes effect only when `capacityLoad` is also enabled.
2. Set `multiCapacityLoad` to `true` in the widget parameters.
3. Ensure `useTeamsService` is `true` (multi-capacity reads per-resource capacity from the Teams Service data).
4. Save the page.
 By default, capacity bars show a tooltip with aggregate **Capacity / Done / Todo / Available** values. You can customize this tooltip to show a per-user allocation breakdown using the `columnTooltipTemplate` parameter.
Set `columnTooltipTemplate` to a template string or a JavaScript function that receives the column and row objects. When no custom template is configured, the default aggregate tooltip is used automatically.
A custom `columnTooltipTemplate` can highlight overallocated users in red. The format typically shows `Available (Overallocated) / Allocated / Total` per team member, making resource bottlenecks easy to spot during planning sessions.
## Known Limitations
Planningboard capacity visualization has the following confirmed gaps relative to Nextedy GANTT:
* **No multi-assignee support** — capacity is calculated from a single assignee per work item. Work items with multiple assignees are not distributed across those users.
* **No sub-item effort distribution** — capacity is calculated from the work items loaded directly onto the board. Effort in child tasks below the displayed level is not rolled up into capacity calculations.
If your planning workflow depends on either of these behaviors, evaluate whether Nextedy GANTT's capacity view better fits your needs.
Capacity configuration parameters are whitespace-sensitive. Ensure there are no leading or trailing spaces in parameter values such as `capacityField`, `selectedTeam`, or `hoursPerDay`. Whitespace errors cause capacity calculations to silently fall back to zero or produce incorrect totals. See [Capacity Calculation Issues](/planningboard/guides/troubleshooting/capacity-issues) if you see unexpected zeros.
## Verification
After saving your widget configuration, reload the Planningboard page. You should now see:
* **Column-level mode (`capacityLoad`):** A progress bar appears at the top of each Plan column, showing aggregate load as a percentage and total hours.
* **Per-user mode (`userCapacityLoad`):** Each assignee swimlane row has a summary cell showing allocated, total, and available hours. Overallocated users appear with a red indicator.
* **Multi-capacity mode (`multiCapacityLoad`):** Individual swimlane cells display their own progress bars.
If capacity bars do not appear, verify that at least one work item in a Plan has a non-zero `remainingEstimate` (or the value of your `capacityField`), and that `useTeamsService` is enabled when required by the mode you selected.
## See Also
* [Configure Capacity Tracking](/planningboard/guides/configuration/capacity-configuration) — widget parameters for capacity configuration
* [Track Team Capacity](/planningboard/guides/capacity/team-capacity) — set up team-level capacity tracking
* [Track User Capacity](/planningboard/guides/capacity/user-capacity) — configure per-user capacity
* [Normalize Capacity Across Swimlanes](/planningboard/guides/capacity/capacity-normalization) — equalize capacity when swimlanes differ in size
* [Set Up Teams Service](/planningboard/guides/capacity/teams-service-setup) — prerequisite for per-user and multi-capacity modes
* [Capacity Calculation Issues](/planningboard/guides/troubleshooting/capacity-issues) — troubleshoot missing or incorrect capacity values
**KB Articles**
* Introduction to Planningboard
* Planningboard: Customizable Statistics and Capacity Indicators
* What is 'Normalization'
**Support Tickets**
* [#6605](https://support.nextedy.com/helpdesk/tickets/6605)
* [#4714](https://support.nextedy.com/helpdesk/tickets/4714)
* [#6777](https://support.nextedy.com/helpdesk/tickets/6777)
**Source Code**
* `PlanningBoardWidget.java`
* `planningboard.js`
* `PlanningBoardDataService.java`
* `perUserCapacity.cy.ts`
* `Config.java`
By default, capacity bars show a tooltip with aggregate **Capacity / Done / Todo / Available** values. You can customize this tooltip to show a per-user allocation breakdown using the `columnTooltipTemplate` parameter.
Set `columnTooltipTemplate` to a template string or a JavaScript function that receives the column and row objects. When no custom template is configured, the default aggregate tooltip is used automatically.
A custom `columnTooltipTemplate` can highlight overallocated users in red. The format typically shows `Available (Overallocated) / Allocated / Total` per team member, making resource bottlenecks easy to spot during planning sessions.
## Known Limitations
Planningboard capacity visualization has the following confirmed gaps relative to Nextedy GANTT:
* **No multi-assignee support** — capacity is calculated from a single assignee per work item. Work items with multiple assignees are not distributed across those users.
* **No sub-item effort distribution** — capacity is calculated from the work items loaded directly onto the board. Effort in child tasks below the displayed level is not rolled up into capacity calculations.
If your planning workflow depends on either of these behaviors, evaluate whether Nextedy GANTT's capacity view better fits your needs.
Capacity configuration parameters are whitespace-sensitive. Ensure there are no leading or trailing spaces in parameter values such as `capacityField`, `selectedTeam`, or `hoursPerDay`. Whitespace errors cause capacity calculations to silently fall back to zero or produce incorrect totals. See [Capacity Calculation Issues](/planningboard/guides/troubleshooting/capacity-issues) if you see unexpected zeros.
## Verification
After saving your widget configuration, reload the Planningboard page. You should now see:
* **Column-level mode (`capacityLoad`):** A progress bar appears at the top of each Plan column, showing aggregate load as a percentage and total hours.
* **Per-user mode (`userCapacityLoad`):** Each assignee swimlane row has a summary cell showing allocated, total, and available hours. Overallocated users appear with a red indicator.
* **Multi-capacity mode (`multiCapacityLoad`):** Individual swimlane cells display their own progress bars.
If capacity bars do not appear, verify that at least one work item in a Plan has a non-zero `remainingEstimate` (or the value of your `capacityField`), and that `useTeamsService` is enabled when required by the mode you selected.
## See Also
* [Configure Capacity Tracking](/planningboard/guides/configuration/capacity-configuration) — widget parameters for capacity configuration
* [Track Team Capacity](/planningboard/guides/capacity/team-capacity) — set up team-level capacity tracking
* [Track User Capacity](/planningboard/guides/capacity/user-capacity) — configure per-user capacity
* [Normalize Capacity Across Swimlanes](/planningboard/guides/capacity/capacity-normalization) — equalize capacity when swimlanes differ in size
* [Set Up Teams Service](/planningboard/guides/capacity/teams-service-setup) — prerequisite for per-user and multi-capacity modes
* [Capacity Calculation Issues](/planningboard/guides/troubleshooting/capacity-issues) — troubleshoot missing or incorrect capacity values
**KB Articles**
* Introduction to Planningboard
* Planningboard: Customizable Statistics and Capacity Indicators
* What is 'Normalization'
**Support Tickets**
* [#6605](https://support.nextedy.com/helpdesk/tickets/6605)
* [#4714](https://support.nextedy.com/helpdesk/tickets/4714)
* [#6777](https://support.nextedy.com/helpdesk/tickets/6777)
**Source Code**
* `PlanningBoardWidget.java`
* `planningboard.js`
* `PlanningBoardDataService.java`
* `perUserCapacity.cy.ts`
* `Config.java`