Last reviewed on {formatted}
; }; ## Access the Markers Script Markers are defined in the **Markers Script**, located under **Widget Properties > Advanced > Markers Script**. This server-side script runs each time the Gantt loads and produces the set of marker lines displayed on the timeline.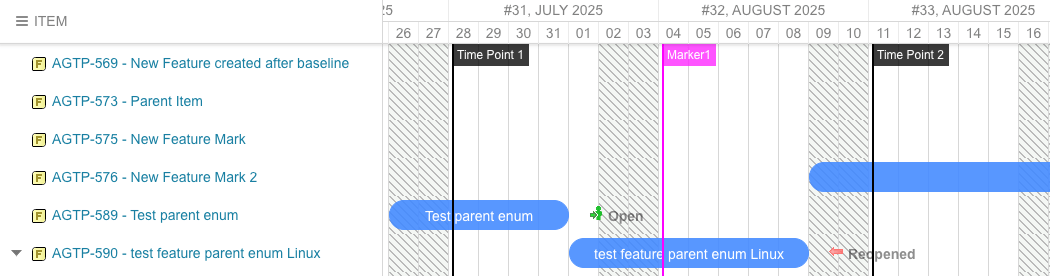 The script has access to the `markerFactory` object, which provides methods for creating markers manually and from Polarion data.
## Add a Marker Manually
To create a single marker at a specific date, use the `markerFactory.addMarker()` method:
```javascript theme={null}
var marker = markerFactory.addMarker();
marker.setText("20.0");
marker.setDate("2025-08-04");
marker.setColor("green");
```
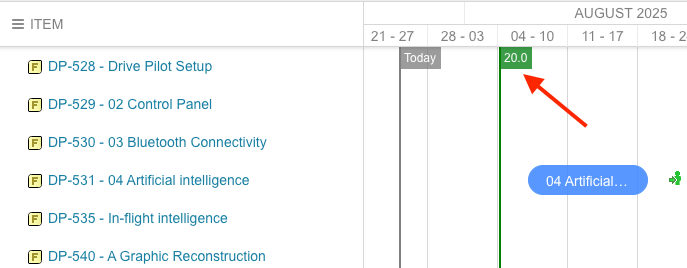
This creates a green vertical line labeled "20.0" on August 4, 2025.
The script has access to the `markerFactory` object, which provides methods for creating markers manually and from Polarion data.
## Add a Marker Manually
To create a single marker at a specific date, use the `markerFactory.addMarker()` method:
```javascript theme={null}
var marker = markerFactory.addMarker();
marker.setText("20.0");
marker.setDate("2025-08-04");
marker.setColor("green");
```
This creates a green vertical line labeled "20.0" on August 4, 2025.
 The marker object provides these methods:
| Method | Description |
| :----------------------------- | :---------------------------------------------------------- |
| `setText(String text)` | Set the marker label displayed on the timeline |
| `setTitle(String tooltip)` | Set the tooltip text shown on hover |
| `setDate(String dateStr)` | Set the marker date (format: `"YYYY-MM-DD"`) |
| `setDate(java.util.Date date)` | Set the marker date from a Java Date object |
| `setColor(String color)` | Set the marker color (one of the 16 basic HTML color names) |
The marker object provides these methods:
| Method | Description |
| :----------------------------- | :---------------------------------------------------------- |
| `setText(String text)` | Set the marker label displayed on the timeline |
| `setTitle(String tooltip)` | Set the tooltip text shown on hover |
| `setDate(String dateStr)` | Set the marker date (format: `"YYYY-MM-DD"`) |
| `setDate(java.util.Date date)` | Set the marker date from a Java Date object |
| `setColor(String color)` | Set the marker color (one of the 16 basic HTML color names) |
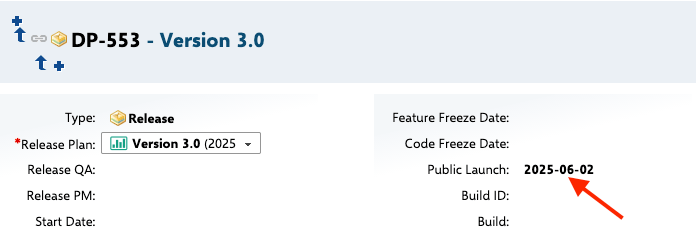 To reference the current project dynamically instead of hard-coding the project ID:
```javascript theme={null}
markerFactory.addWorkItemMarkers(
"type:release AND project.id:" + config.getContextProjectId(),
"publicLaunch",
"blue"
)
```
To reference the current project dynamically instead of hard-coding the project ID:
```javascript theme={null}
markerFactory.addWorkItemMarkers(
"type:release AND project.id:" + config.getContextProjectId(),
"publicLaunch",
"blue"
)
```
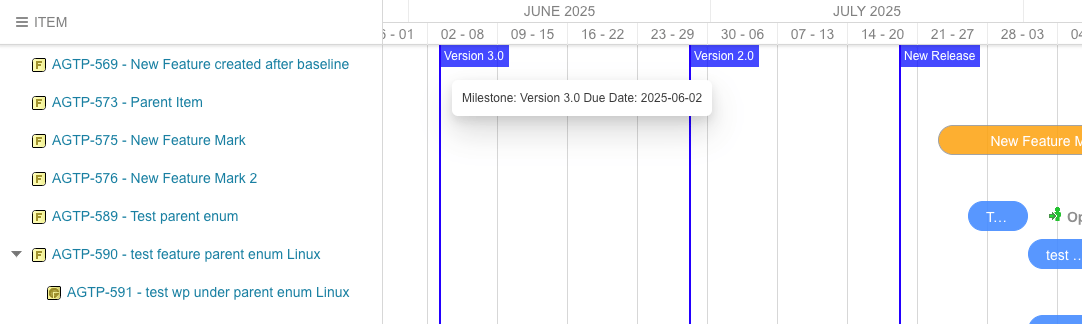 ## Use the Polarion API for Dynamic Markers
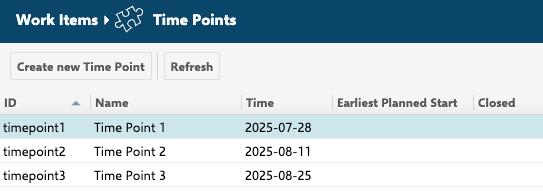
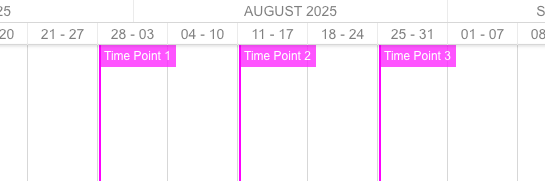
For full scripting control, use the `trackerService` API to query Polarion data and build markers dynamically. This approach supports conditional logic, custom tooltips, and color-coding based on field values.
**Example: Load Time Points as markers:**
```javascript theme={null}
var timePoints = trackerService.getTrackerProject("GANTT")
.getTimePoints().iterator();
while(timePoints.hasNext()) {
var tp = timePoints.next();
var marker = markerFactory.addMarker();
marker.setText(tp.getName());
marker.setDate(tp.getTime().getDate());
marker.setColor("fuchsia");
var desc = tp.getDescription();
if(desc != null) {
marker.setTitle(desc.getContent());
}
}
```
## Use the Polarion API for Dynamic Markers
For full scripting control, use the `trackerService` API to query Polarion data and build markers dynamically. This approach supports conditional logic, custom tooltips, and color-coding based on field values.
**Example: Load Time Points as markers:**
```javascript theme={null}
var timePoints = trackerService.getTrackerProject("GANTT")
.getTimePoints().iterator();
while(timePoints.hasNext()) {
var tp = timePoints.next();
var marker = markerFactory.addMarker();
marker.setText(tp.getName());
marker.setDate(tp.getTime().getDate());
marker.setColor("fuchsia");
var desc = tp.getDescription();
if(desc != null) {
marker.setTitle(desc.getContent());
}
}
```
 **Example: Dynamic markers from page parameters:**
```javascript theme={null}
var milestoneIds = config.pageParameters.milestone;
if(milestoneIds === null) {
milestoneIds = "";
} else {
milestoneIds = milestoneIds.replaceAll(',', ' ');
}
var milestones = trackerService.queryWorkItems(
"project.id:Gantt3 AND type:milestone AND id:(" + milestoneIds + ")",
"id"
).iterator();
while(milestones.hasNext()) {
var tp = milestones.next();
var marker = markerFactory.addMarker();
marker.setText(tp.getTitle());
marker.setDate(tp.getValue('releaseDate').getDate());
marker.setColor("blue");
}
```
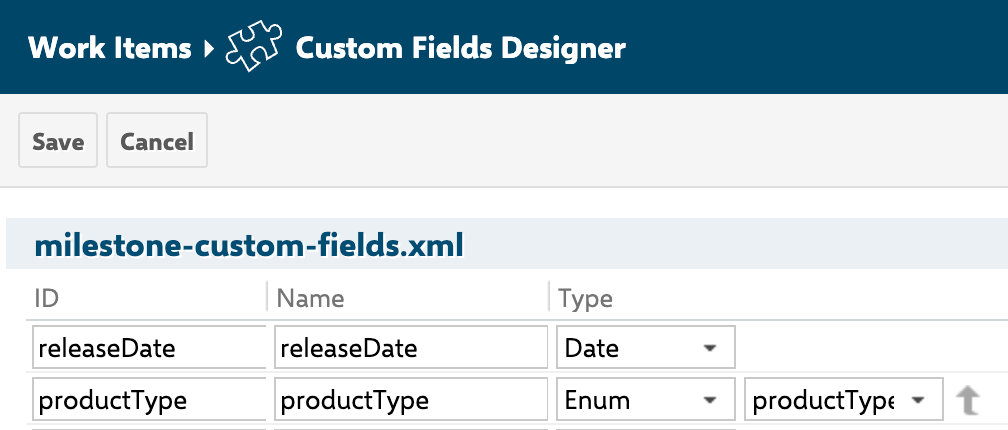
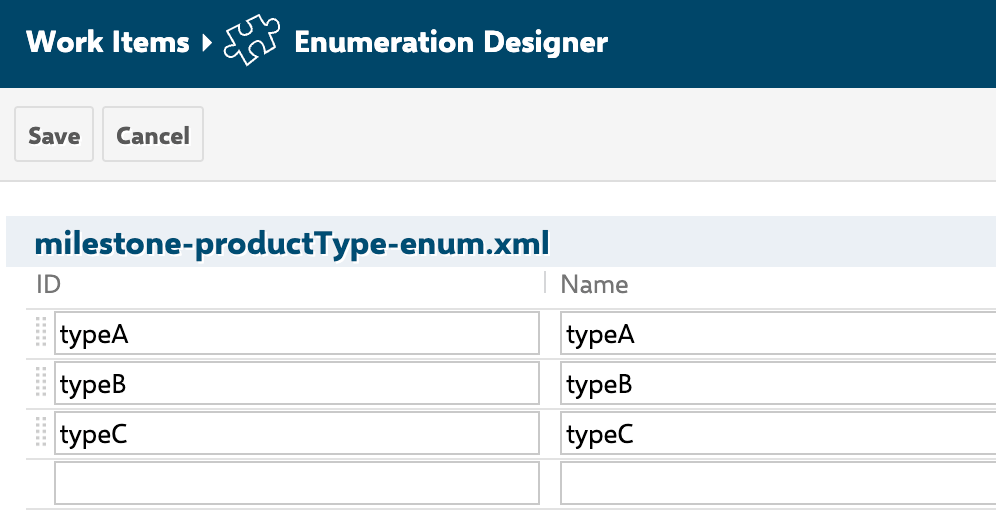
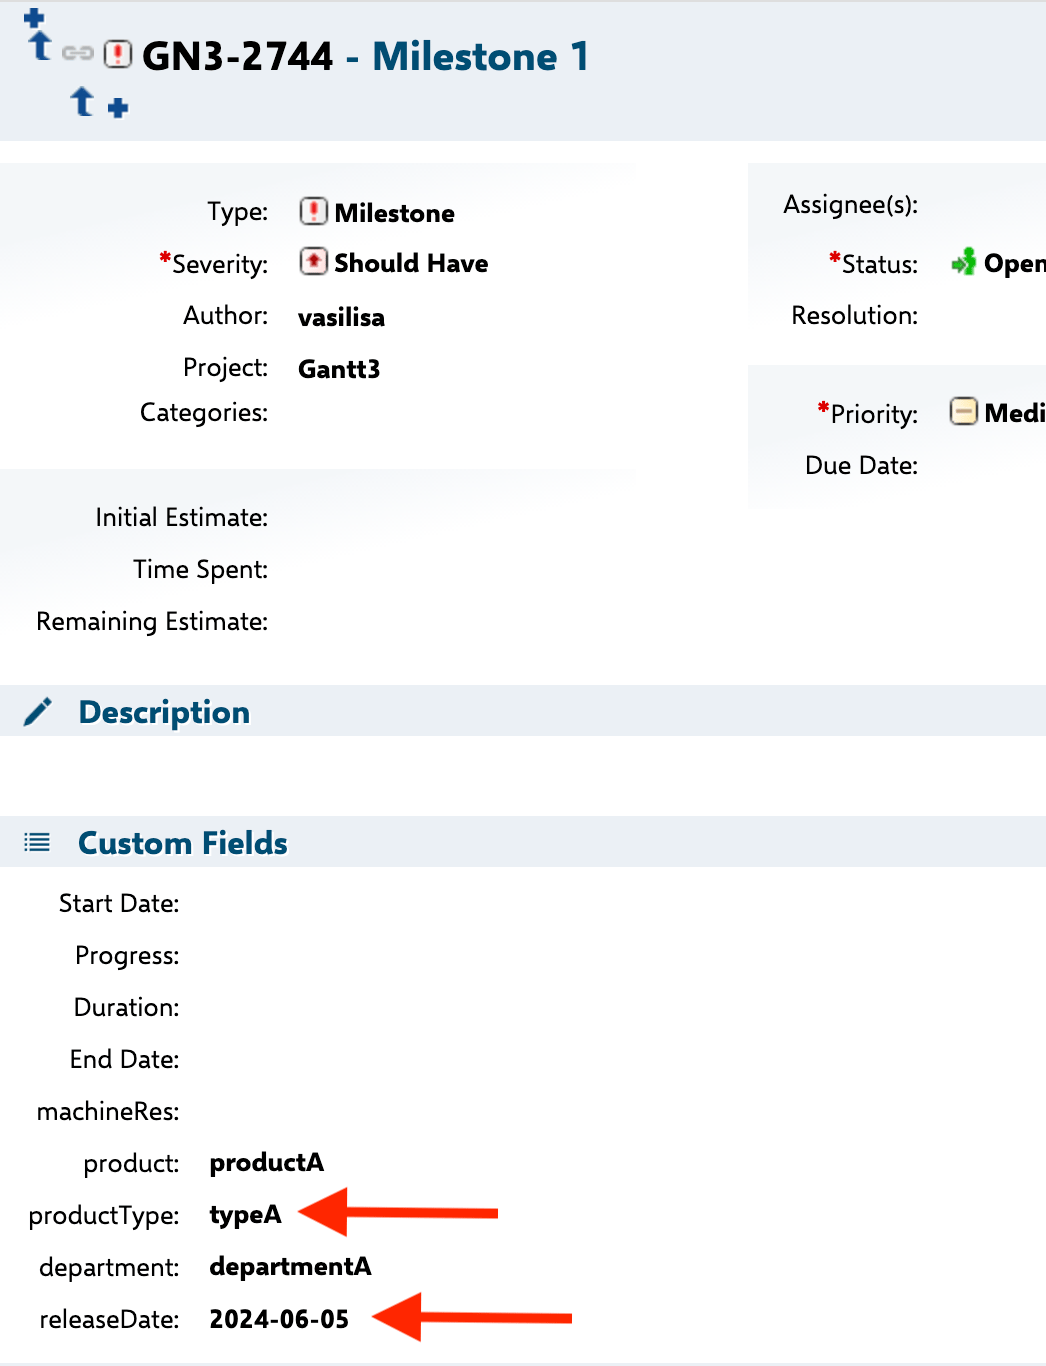
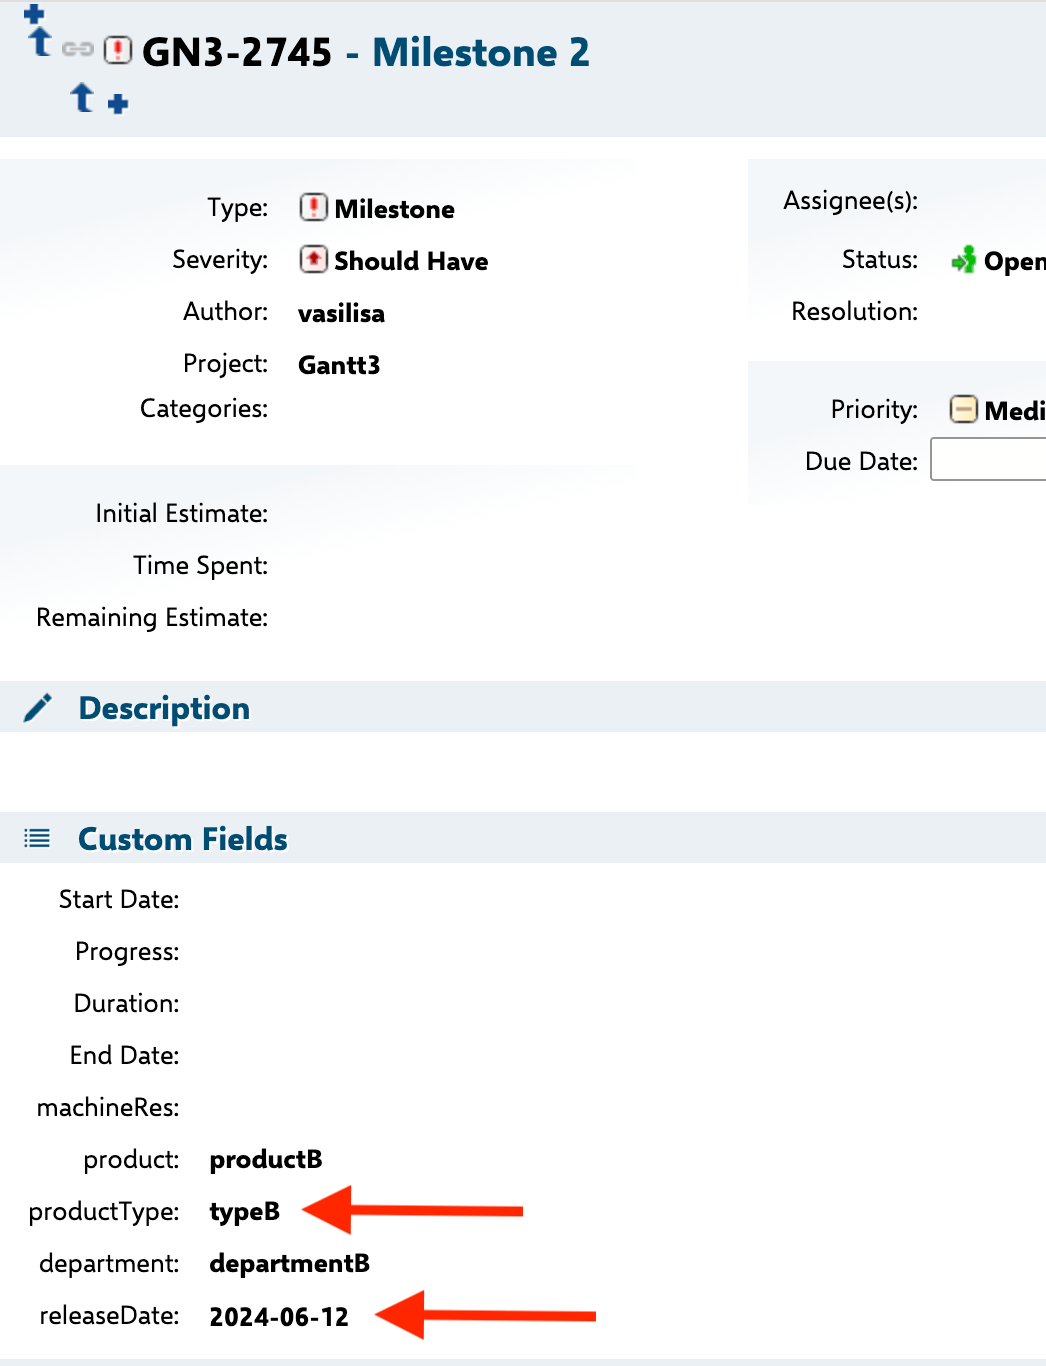
This example works with Milestone-type work items that carry two custom fields: `releaseDate` (a date) and `productType` (an enumeration with values such as typeA, typeB, and typeC).
**Example: Dynamic markers from page parameters:**
```javascript theme={null}
var milestoneIds = config.pageParameters.milestone;
if(milestoneIds === null) {
milestoneIds = "";
} else {
milestoneIds = milestoneIds.replaceAll(',', ' ');
}
var milestones = trackerService.queryWorkItems(
"project.id:Gantt3 AND type:milestone AND id:(" + milestoneIds + ")",
"id"
).iterator();
while(milestones.hasNext()) {
var tp = milestones.next();
var marker = markerFactory.addMarker();
marker.setText(tp.getTitle());
marker.setDate(tp.getValue('releaseDate').getDate());
marker.setColor("blue");
}
```
This example works with Milestone-type work items that carry two custom fields: `releaseDate` (a date) and `productType` (an enumeration with values such as typeA, typeB, and typeC).
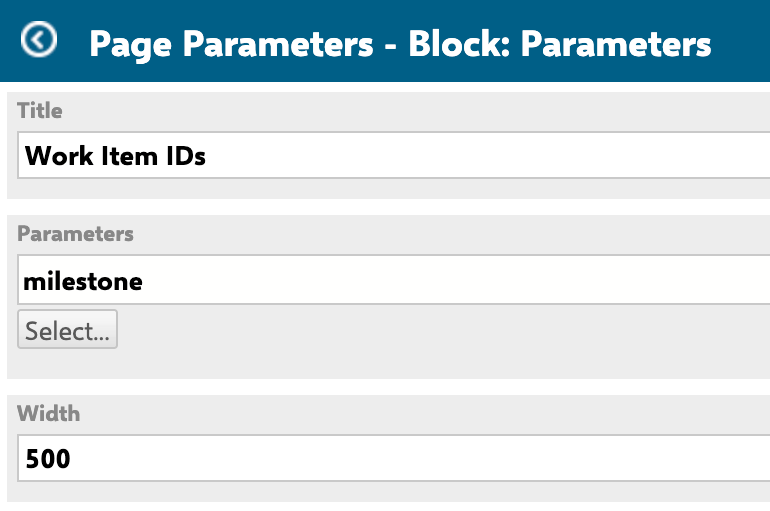
 Define the page parameter that drives the query as an Enumeration-type parameter so editors get a dropdown of milestone work items. Its ID must match the one referenced in the script — here, `milestone`.
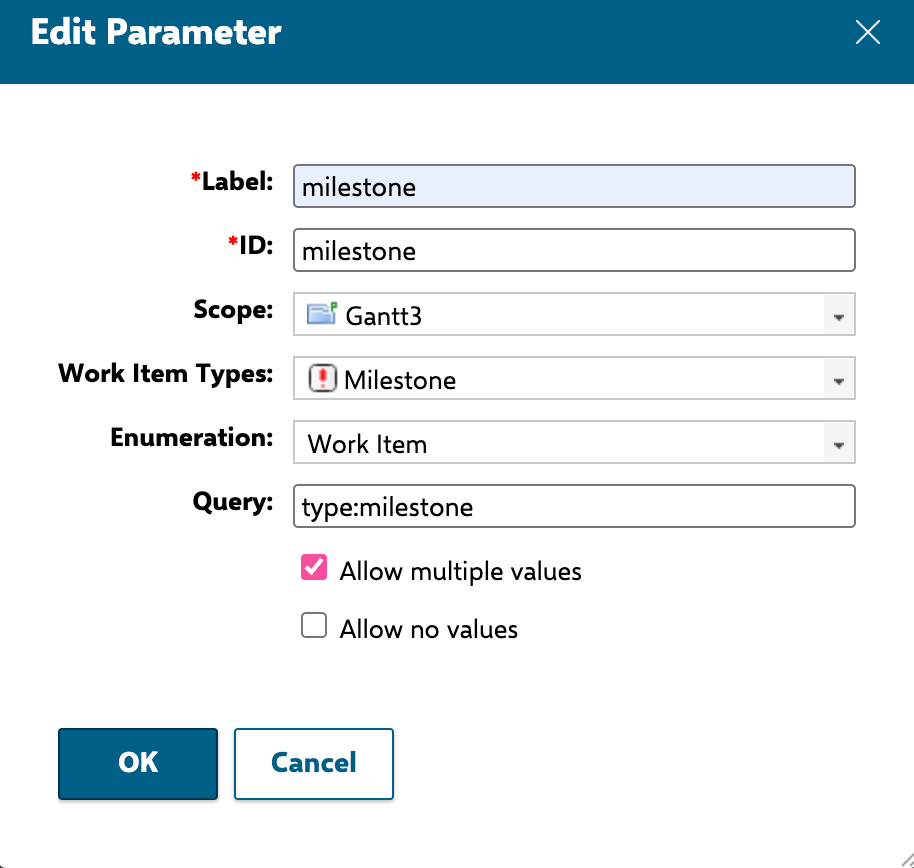 This reads a comma-separated list of work item IDs from the `milestone` page parameter, queries them, and renders each as a marker. Changing the page parameter updates which markers appear without editing the script.
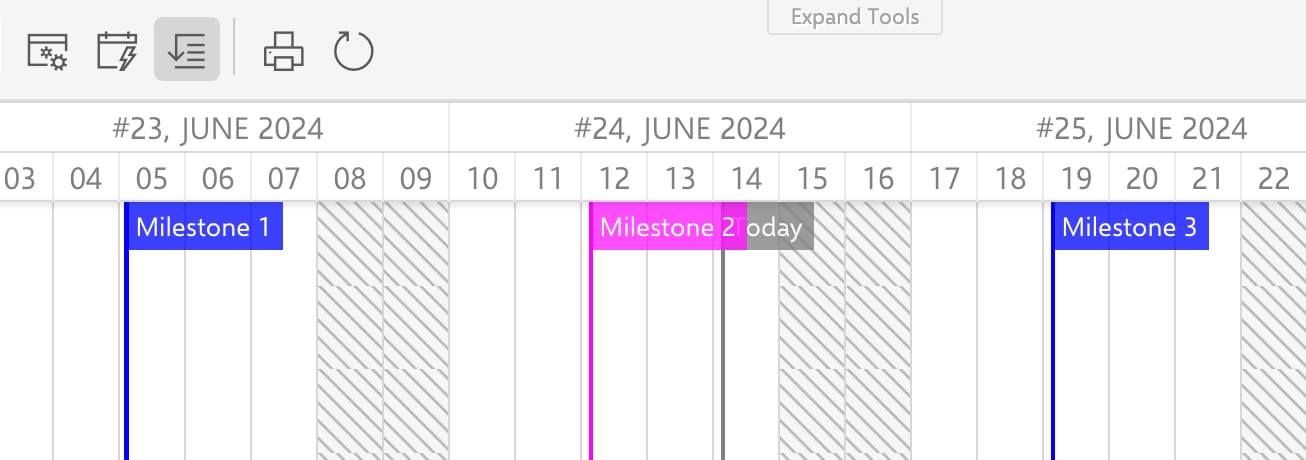
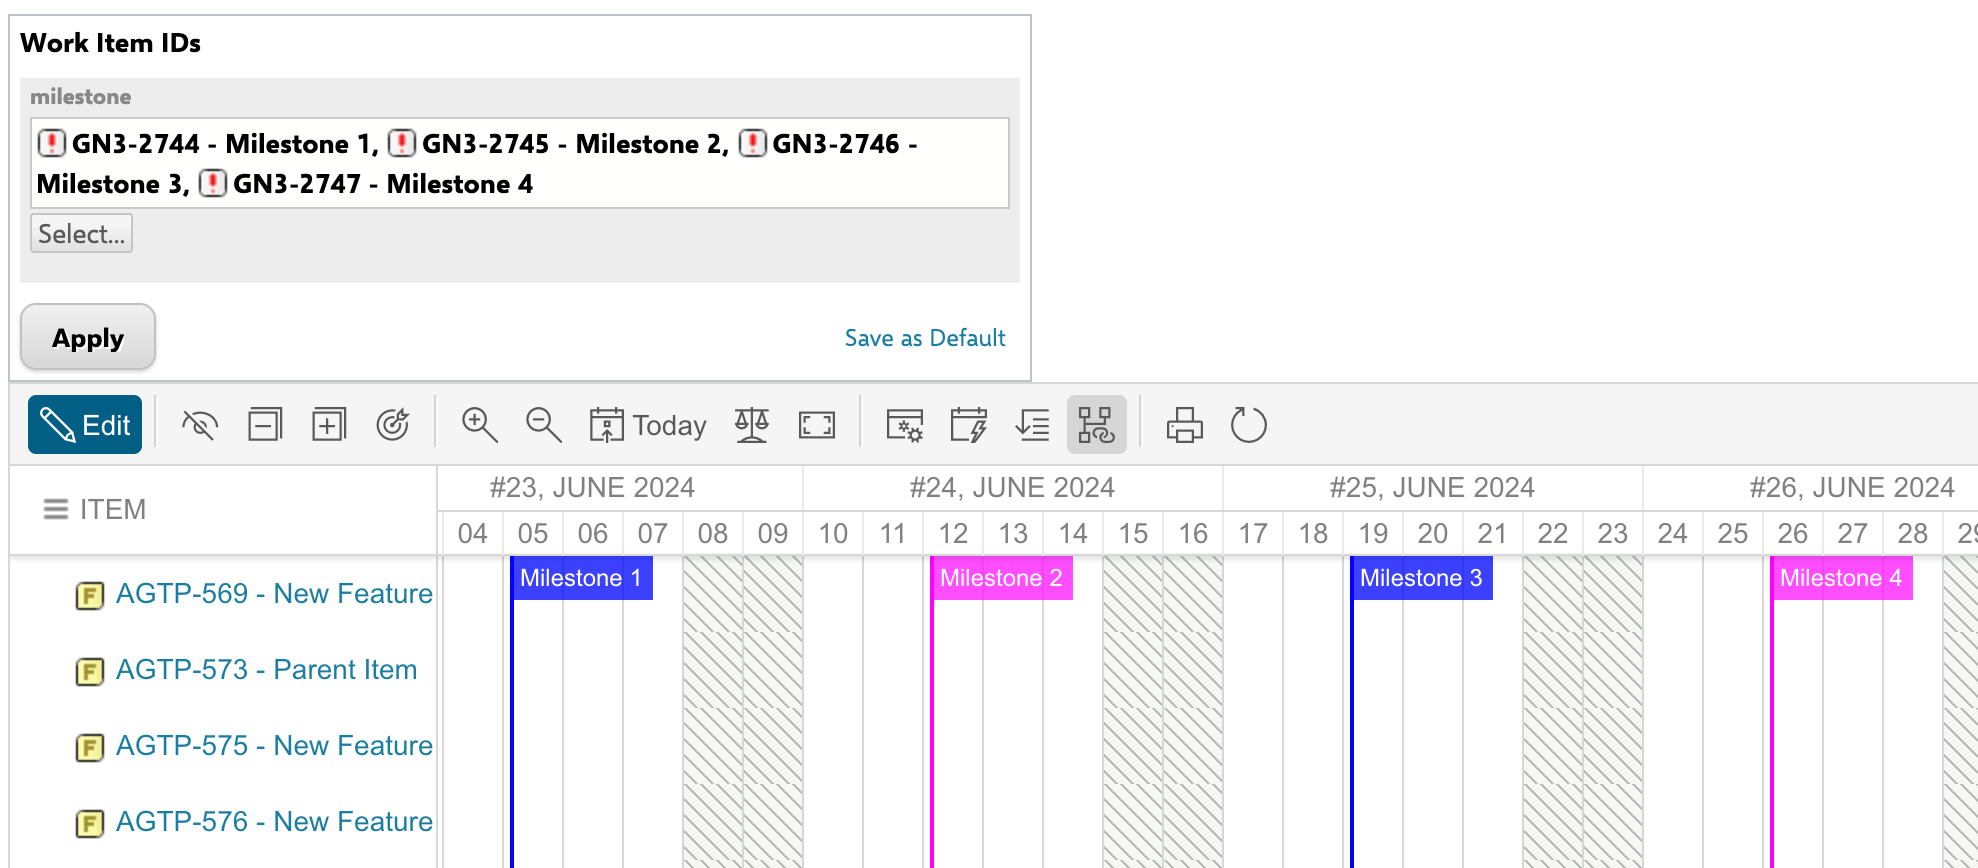
As a result, only the selected work items appear as markers, dated from their `releaseDate` field. Milestones 1 and 3 appear blue because their `productType` has a value, while Milestone 2 is pink because its `productType` is typeB.
This reads a comma-separated list of work item IDs from the `milestone` page parameter, queries them, and renders each as a marker. Changing the page parameter updates which markers appear without editing the script.
As a result, only the selected work items appear as markers, dated from their `releaseDate` field. Milestones 1 and 3 appear blue because their `productType` has a value, while Milestone 2 is pink because its `productType` is typeB.
 To switch the displayed markers quickly, add a Page Parameters Block widget to the same page as the Gantt and expose the `milestone` parameter there.
 ## Marker CSS Classes
Markers receive CSS classes based on their type, which you can use for custom styling:
| CSS Class | Applied To |
| :------------- | :--------------------------------------------------- |
| `today` | The automatic today-date marker |
| `plan` | Markers created from Plan items via `addPlanMarkers` |
| `gantt_marker` | All custom markers (base class) |
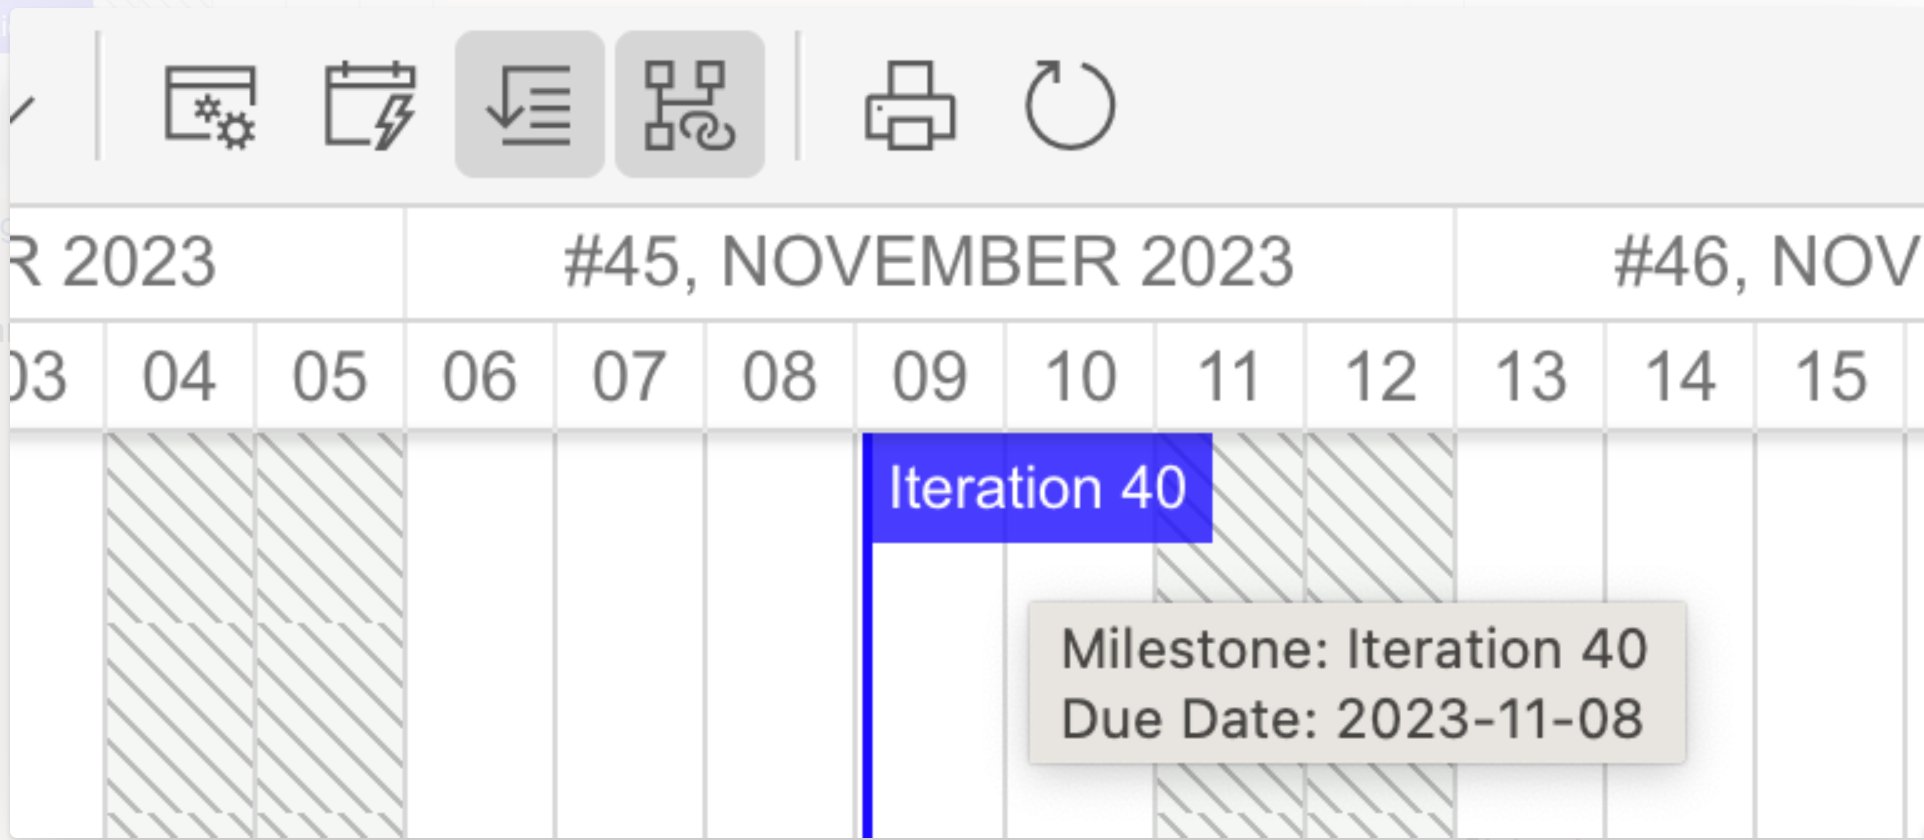
To keep only the marker line and hide its header label, add a script-block widget above the Gantt that sets `.gantt_marker_content { display: none; }`. The result shows the marker line without its text header.
## Marker CSS Classes
Markers receive CSS classes based on their type, which you can use for custom styling:
| CSS Class | Applied To |
| :------------- | :--------------------------------------------------- |
| `today` | The automatic today-date marker |
| `plan` | Markers created from Plan items via `addPlanMarkers` |
| `gantt_marker` | All custom markers (base class) |
To keep only the marker line and hide its header label, add a script-block widget above the Gantt that sets `.gantt_marker_content { display: none; }`. The result shows the marker line without its text header.

 ## Verification
You should now see vertical marker lines on the Gantt timeline at the configured dates. Hover over each marker to verify the tooltip displays the expected name and date. If markers do not appear, check the Markers Script for errors using the warning indicator in the Gantt toolbar area.
## See also
* [Configure Milestone Work Items](/gantt/guides/visualization/milestones)
* [Create Markers with Scripts](/gantt/guides/scripting/marker-scripts)
* [Configure Page Parameters](/gantt/guides/layout/page-parameters)
* [Customize Gantt Tooltips](/gantt/guides/visualization/tooltips)
* [Show Deadlines and Due Dates](/gantt/guides/visualization/deadlines)
## Verification
You should now see vertical marker lines on the Gantt timeline at the configured dates. Hover over each marker to verify the tooltip displays the expected name and date. If markers do not appear, check the Markers Script for errors using the warning indicator in the Gantt toolbar area.
## See also
* [Configure Milestone Work Items](/gantt/guides/visualization/milestones)
* [Create Markers with Scripts](/gantt/guides/scripting/marker-scripts)
* [Configure Page Parameters](/gantt/guides/layout/page-parameters)
* [Customize Gantt Tooltips](/gantt/guides/visualization/tooltips)
* [Show Deadlines and Due Dates](/gantt/guides/visualization/deadlines)