> ## Documentation Index
> Fetch the complete documentation index at: https://learn.nextedy.com/llms.txt
> Use this file to discover all available pages before exploring further.
# Set the Gantt Time Range
> Control which date range is visible in your Nextedy GANTT chart by setting explicit start and end boundaries.
export const LastReviewed = ({date}) => {
if (!date) return null;
const formatted = new Date(`${date}T00:00:00Z`).toLocaleDateString("en-US", {
year: "numeric",
month: "long",
day: "numeric",
timeZone: "UTC"
});
return
Last reviewed on {formatted}
;
};
## Set a Fixed Time Range via Script
To define a static date range, add the following to **Widget Properties > Advanced > Gantt Config Script**:
```javascript theme={null}
gantt.config.start_date = new Date(2024, 11, 10);
gantt.config.end_date = new Date(2025, 7, 20);
```
In JavaScript, months are numbered starting from 0 (January = 0, December = 11). The example above sets the range from **December 10, 2024** to **August 20, 2025**, not November-to-July.
| Month | JavaScript Value | Month | JavaScript Value |
| -------- | ---------------- | --------- | ---------------- |
| January | 0 | July | 6 |
| February | 1 | August | 7 |
| March | 2 | September | 8 |
| April | 3 | October | 9 |
| May | 4 | November | 10 |
| June | 5 | December | 11 |
## Set a Dynamic Time Range via Page Parameters
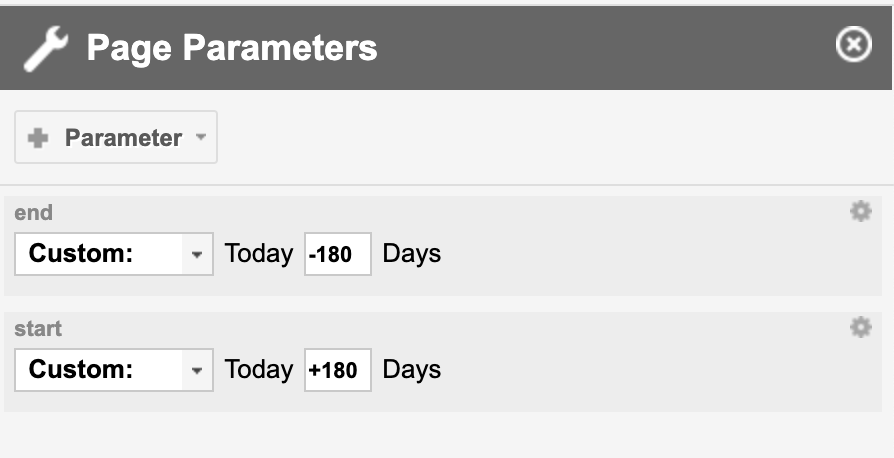
For dashboards where users need to select the visible date range, use **Polarion Page Parameters** to make the range interactive.
1. Add two Date-type page parameters to your LiveDoc page, named `start` and `end`.
2. Add the following to **Widget Properties > Advanced > Gantt Config Script**:
```javascript theme={null}
gantt.config.start_date = new Date($widgetContext.pageParameters.start.value.time);
gantt.config.end_date = new Date($widgetContext.pageParameters.end.value.time);
```
If your page parameters have different IDs, replace `start` and `end` with the actual parameter names.
 The time range filter works alongside other Gantt filters (text filter, resource filter, closed items filter). Tasks outside the configured date range are hidden from the chart even if they match other filter criteria.
## Footer Indicator for Filtered Items
Starting with version 25.3.1, when a time range filter is active and some items are hidden, the Gantt footer displays:
* The count of visible rows versus total rows
* A funnel icon with a tooltip describing the active time range
The time range filter works alongside other Gantt filters (text filter, resource filter, closed items filter). Tasks outside the configured date range are hidden from the chart even if they match other filter criteria.
## Footer Indicator for Filtered Items
Starting with version 25.3.1, when a time range filter is active and some items are hidden, the Gantt footer displays:
* The count of visible rows versus total rows
* A funnel icon with a tooltip describing the active time range
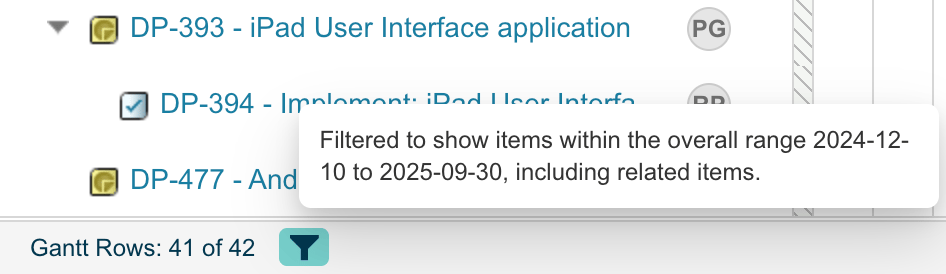 This indicator helps users understand that tasks may be hidden because they fall outside the configured date range, not because they are missing from the data set.
## Reset to Auto-Fit
To remove the time range constraint and return to the default behavior (auto-fit to loaded items), simply remove the `gantt.config.start_date` and `gantt.config.end_date` lines from the Gantt Config Script. The chart will automatically adjust its visible range to fit all loaded work items.
## Verification
After configuring the time range:
1. Open your Gantt chart and verify the timeline header shows dates within your specified range.
2. If tasks exist outside your range, confirm they are hidden from the chart.
3. Check the footer for the filtered items indicator showing how many rows are visible versus total.
## See Also
* [Configure the Time Scale](/gantt/guides/visualization/timescale) -- adjust zoom levels and header formats within your time range
* [Configure Page Parameters](/gantt/guides/layout/page-parameters) -- set up page parameters for dynamic filtering
* [Schedule in Hours Instead of Days](/gantt/guides/scheduling/hour-precision) -- combine time range with hour-precision scheduling
* [Manage Large Datasets with Max Items](/gantt/guides/filtering/max-items) -- another approach to limiting visible data
This indicator helps users understand that tasks may be hidden because they fall outside the configured date range, not because they are missing from the data set.
## Reset to Auto-Fit
To remove the time range constraint and return to the default behavior (auto-fit to loaded items), simply remove the `gantt.config.start_date` and `gantt.config.end_date` lines from the Gantt Config Script. The chart will automatically adjust its visible range to fit all loaded work items.
## Verification
After configuring the time range:
1. Open your Gantt chart and verify the timeline header shows dates within your specified range.
2. If tasks exist outside your range, confirm they are hidden from the chart.
3. Check the footer for the filtered items indicator showing how many rows are visible versus total.
## See Also
* [Configure the Time Scale](/gantt/guides/visualization/timescale) -- adjust zoom levels and header formats within your time range
* [Configure Page Parameters](/gantt/guides/layout/page-parameters) -- set up page parameters for dynamic filtering
* [Schedule in Hours Instead of Days](/gantt/guides/scheduling/hour-precision) -- combine time range with hour-precision scheduling
* [Manage Large Datasets with Max Items](/gantt/guides/filtering/max-items) -- another approach to limiting visible data