> ## Documentation Index
> Fetch the complete documentation index at: https://learn.nextedy.com/llms.txt
> Use this file to discover all available pages before exploring further.
# Set Up the Resource View
> Enable and configure the Nextedy GANTT resource view to display workload allocation for each team member or team directly below the Gantt chart.
export const LastReviewed = ({date}) => {
if (!date) return null;
const formatted = new Date(`${date}T00:00:00Z`).toLocaleDateString("en-US", {
year: "numeric",
month: "long",
day: "numeric",
timeZone: "UTC"
});
return
Last reviewed on {formatted}
;
};
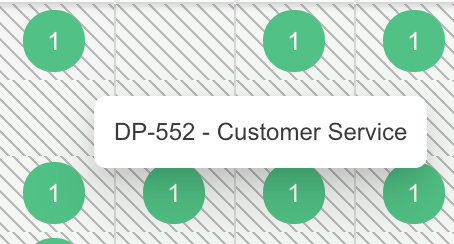
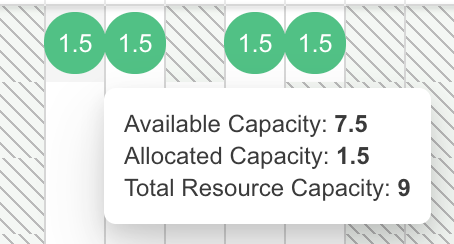
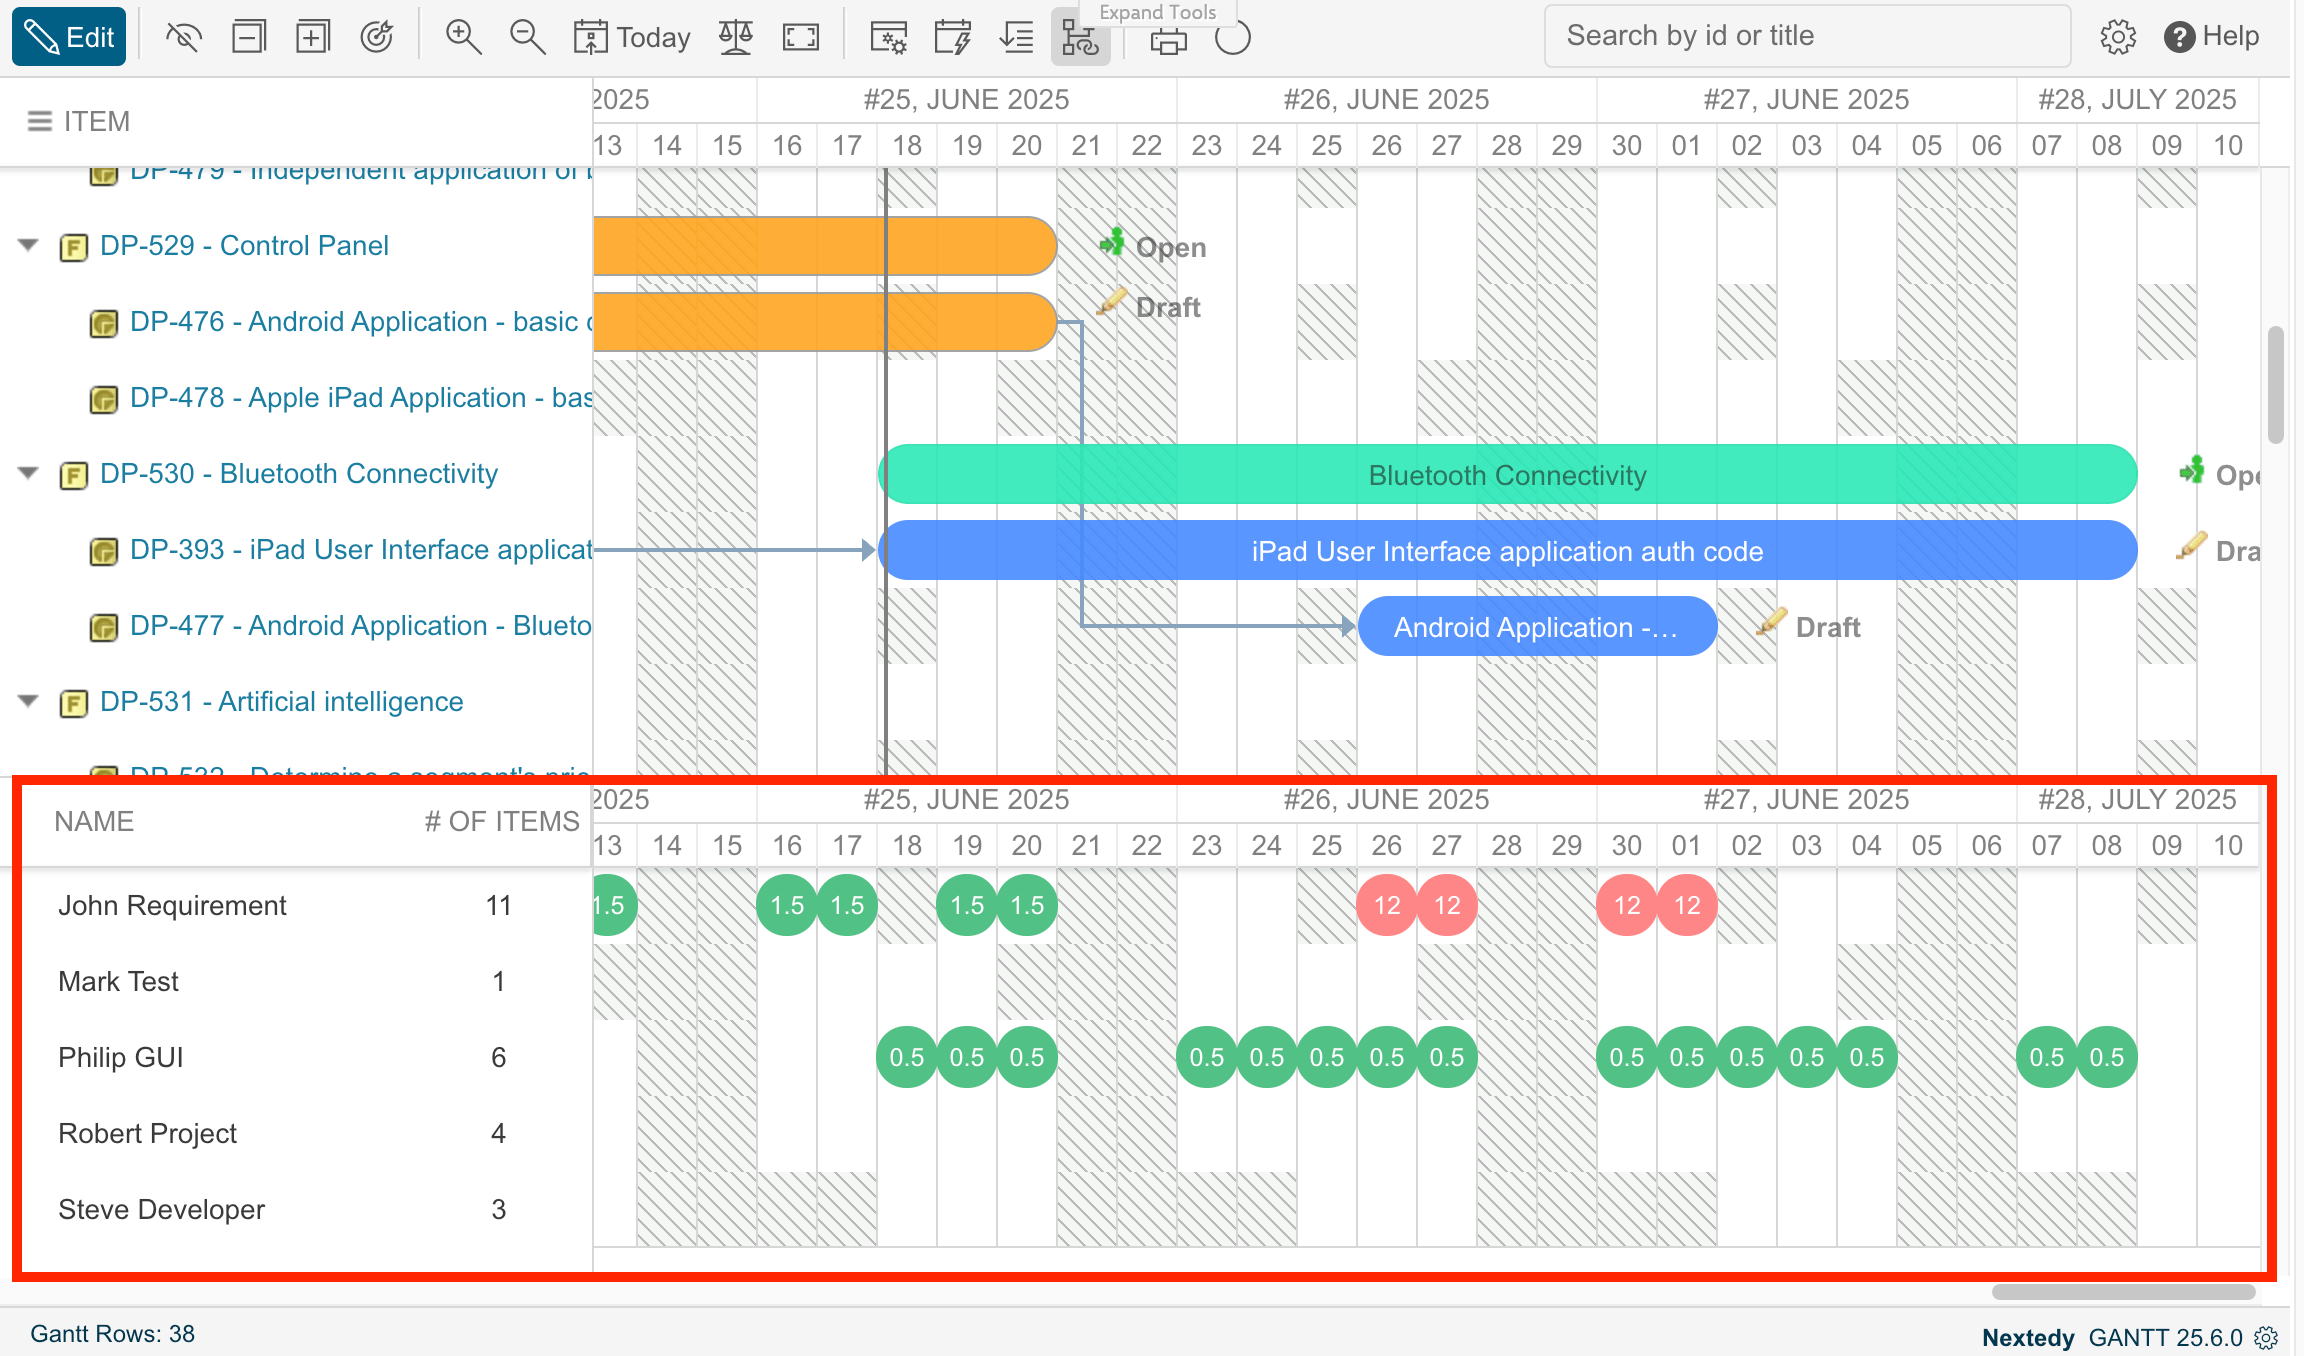 The Resource View adds a grid below the Gantt timeline with one row per resource. Cell values indicate the effort assigned to each user, and hovering over a load cell reveals a tooltip with work item IDs or capacity details.
 1. Open the Gantt page in **Edit mode**.
2. Click the widget gear icon to open **Widget Parameters**.
3. In the **Resource View** section, set **Show Resource View** to **Yes**.
4. Click **Apply**.
Once enabled, additional parameters appear in the Resource View section.
1. Open the Gantt page in **Edit mode**.
2. Click the widget gear icon to open **Widget Parameters**.
3. In the **Resource View** section, set **Show Resource View** to **Yes**.
4. Click **Apply**.
Once enabled, additional parameters appear in the Resource View section.
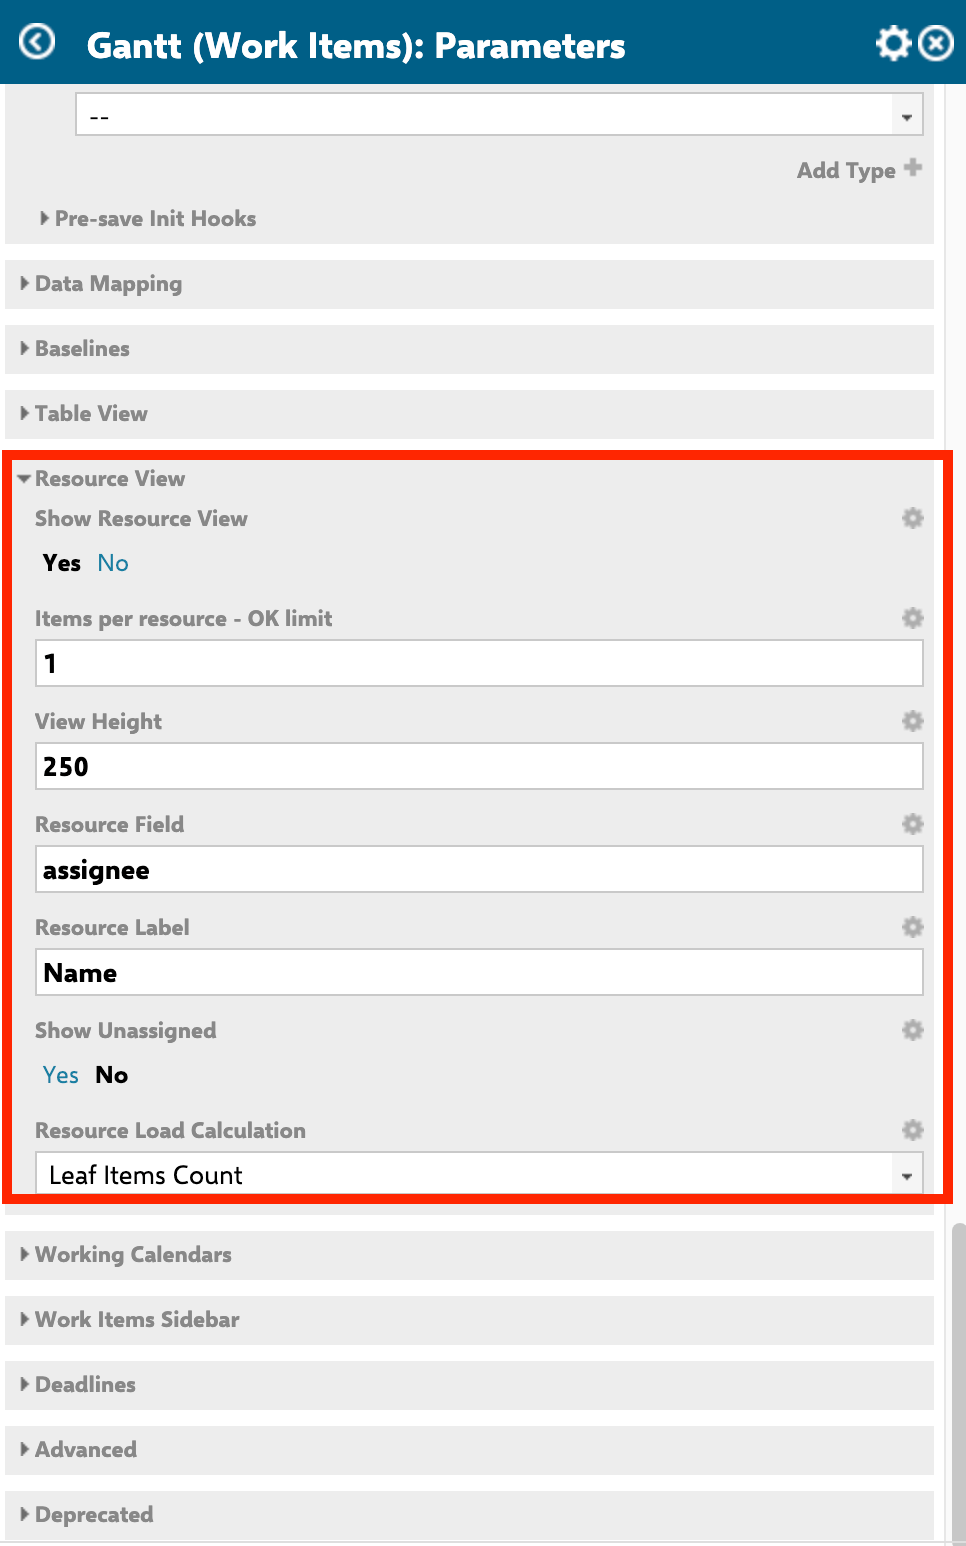 Resource view sub-parameters such as View Height, Resource Field, and Resource Load Calculation only become visible after you set Show Resource View to Yes.
| Parameter | Description | Default |
| ----------------------------- | ---------------------------------------------------------------------------------------- | ---------------- |
| **Show Resource View** | Enables the resource view panel | No |
| **Items per Resource** | Maximum items per resource before overallocation is flagged (Leaf Items Count mode only) | 1 |
| **View Height** | Default pixel height of the resource view panel | 250 |
| **Resource Field** | Work item field used to identify resources | `assignee` |
| **Resource Label** | Column header text for the resource list | - |
| **Show Unassigned** | Display a row for work items with no assigned resource | No |
| **Resource Load Calculation** | How workload values are computed in each cell | Leaf Items Count |
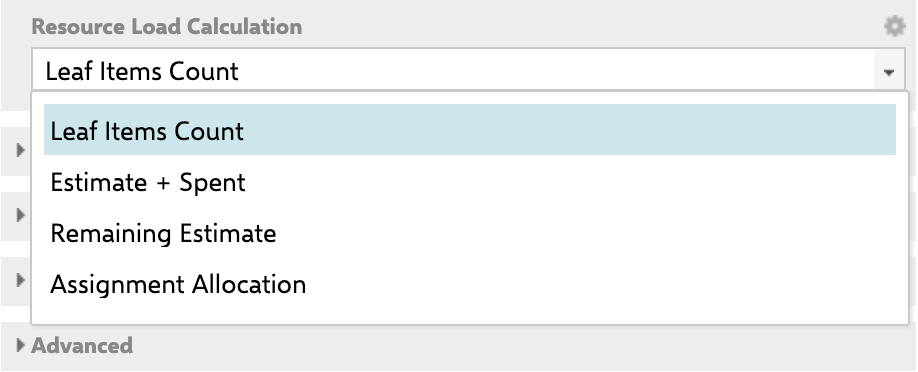
The Gantt offers four calculation modes for the resource view cells:
Resource view sub-parameters such as View Height, Resource Field, and Resource Load Calculation only become visible after you set Show Resource View to Yes.
| Parameter | Description | Default |
| ----------------------------- | ---------------------------------------------------------------------------------------- | ---------------- |
| **Show Resource View** | Enables the resource view panel | No |
| **Items per Resource** | Maximum items per resource before overallocation is flagged (Leaf Items Count mode only) | 1 |
| **View Height** | Default pixel height of the resource view panel | 250 |
| **Resource Field** | Work item field used to identify resources | `assignee` |
| **Resource Label** | Column header text for the resource list | - |
| **Show Unassigned** | Display a row for work items with no assigned resource | No |
| **Resource Load Calculation** | How workload values are computed in each cell | Leaf Items Count |
The Gantt offers four calculation modes for the resource view cells:
 | Mode | What It Shows | Best For |
| ------------------------- | ----------------------------------------------------------------------------- | -------------------------- |
| **Leaf Items Count** | Number of leaf-level work items assigned per time period | Simple task counting |
| **Estimate + Spent** | Remaining estimate plus time already spent, distributed across scheduled days | Full effort picture |
| **Remaining Estimate** | Only future remaining effort, distributed from today onward | Forecasting remaining work |
| **Assignment Allocation** | Percentage-based team allocation from team assignment work items | Team capacity planning |
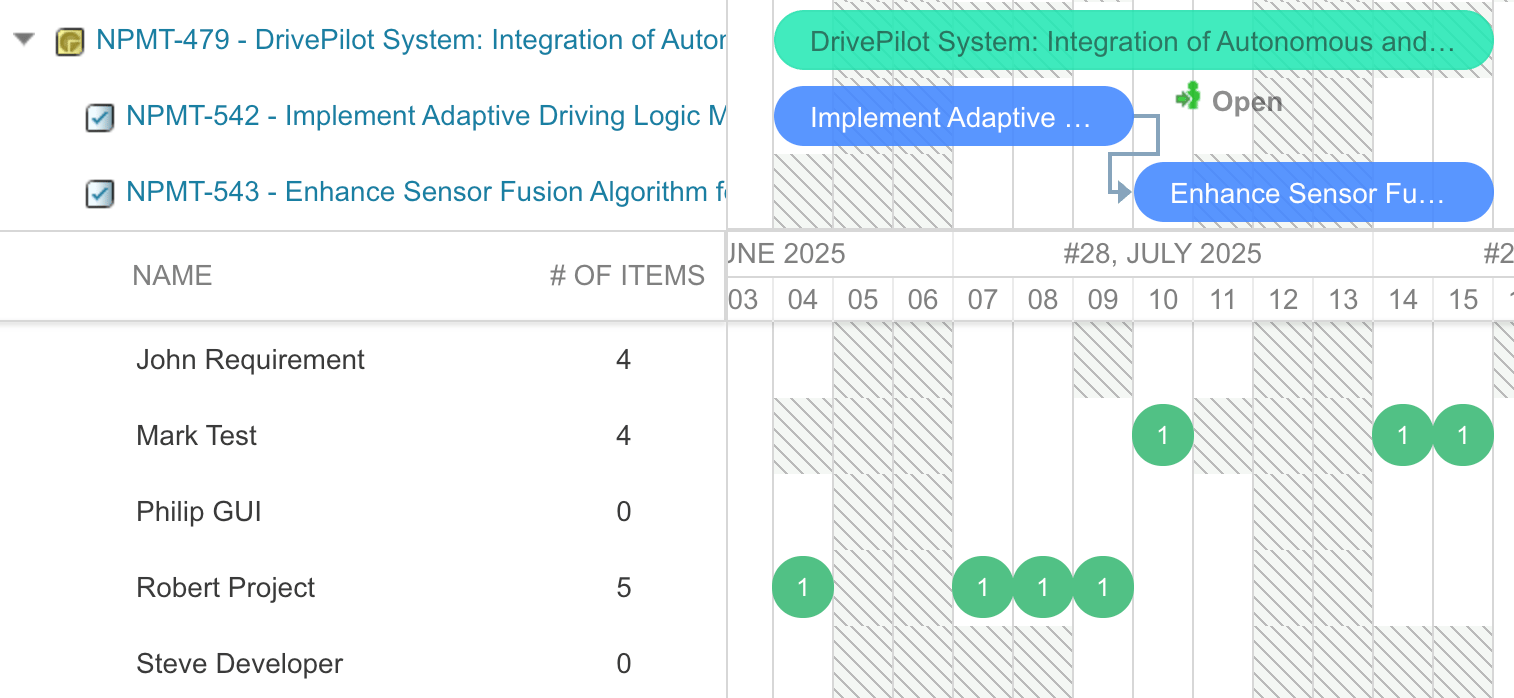
**Leaf Items Count** counts each leaf-level item as one unit. In the example below, the two leaf items each contribute a green cell marked "1" for their scheduled timeframe.
| Mode | What It Shows | Best For |
| ------------------------- | ----------------------------------------------------------------------------- | -------------------------- |
| **Leaf Items Count** | Number of leaf-level work items assigned per time period | Simple task counting |
| **Estimate + Spent** | Remaining estimate plus time already spent, distributed across scheduled days | Full effort picture |
| **Remaining Estimate** | Only future remaining effort, distributed from today onward | Forecasting remaining work |
| **Assignment Allocation** | Percentage-based team allocation from team assignment work items | Team capacity planning |
**Leaf Items Count** counts each leaf-level item as one unit. In the example below, the two leaf items each contribute a green cell marked "1" for their scheduled timeframe.
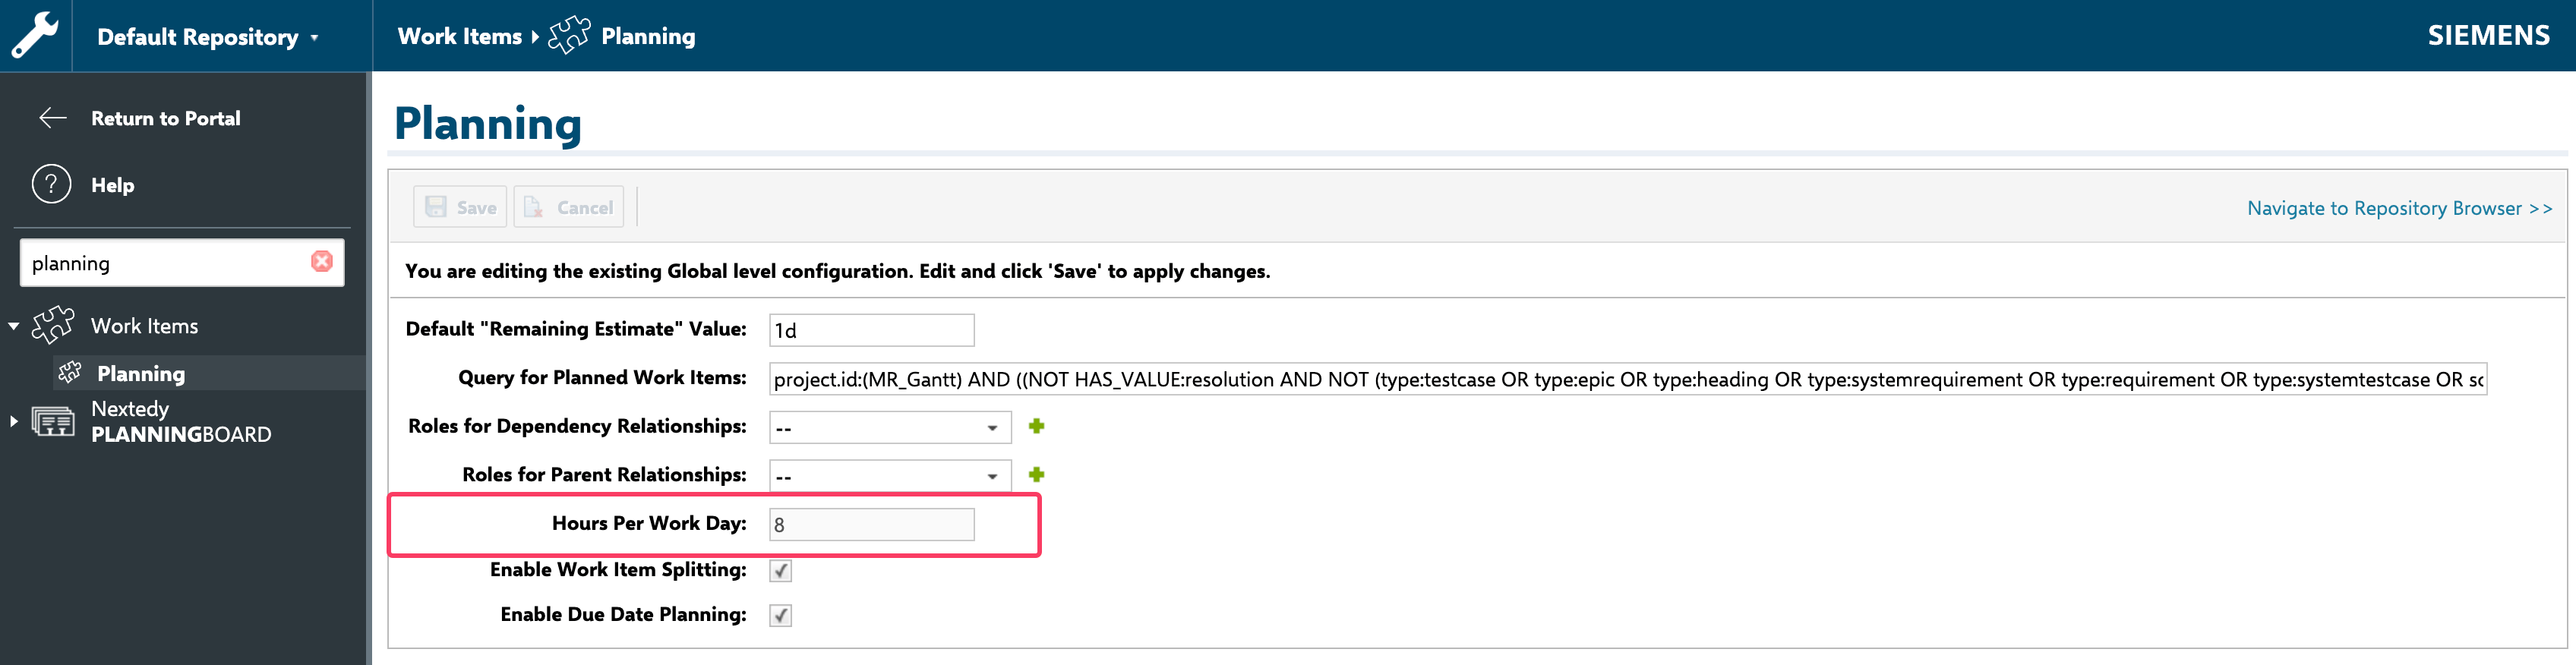
 **Estimate + Spent** combines remaining estimate with time already spent and distributes it across the scheduled days, making it easy to spot overloaded team members.
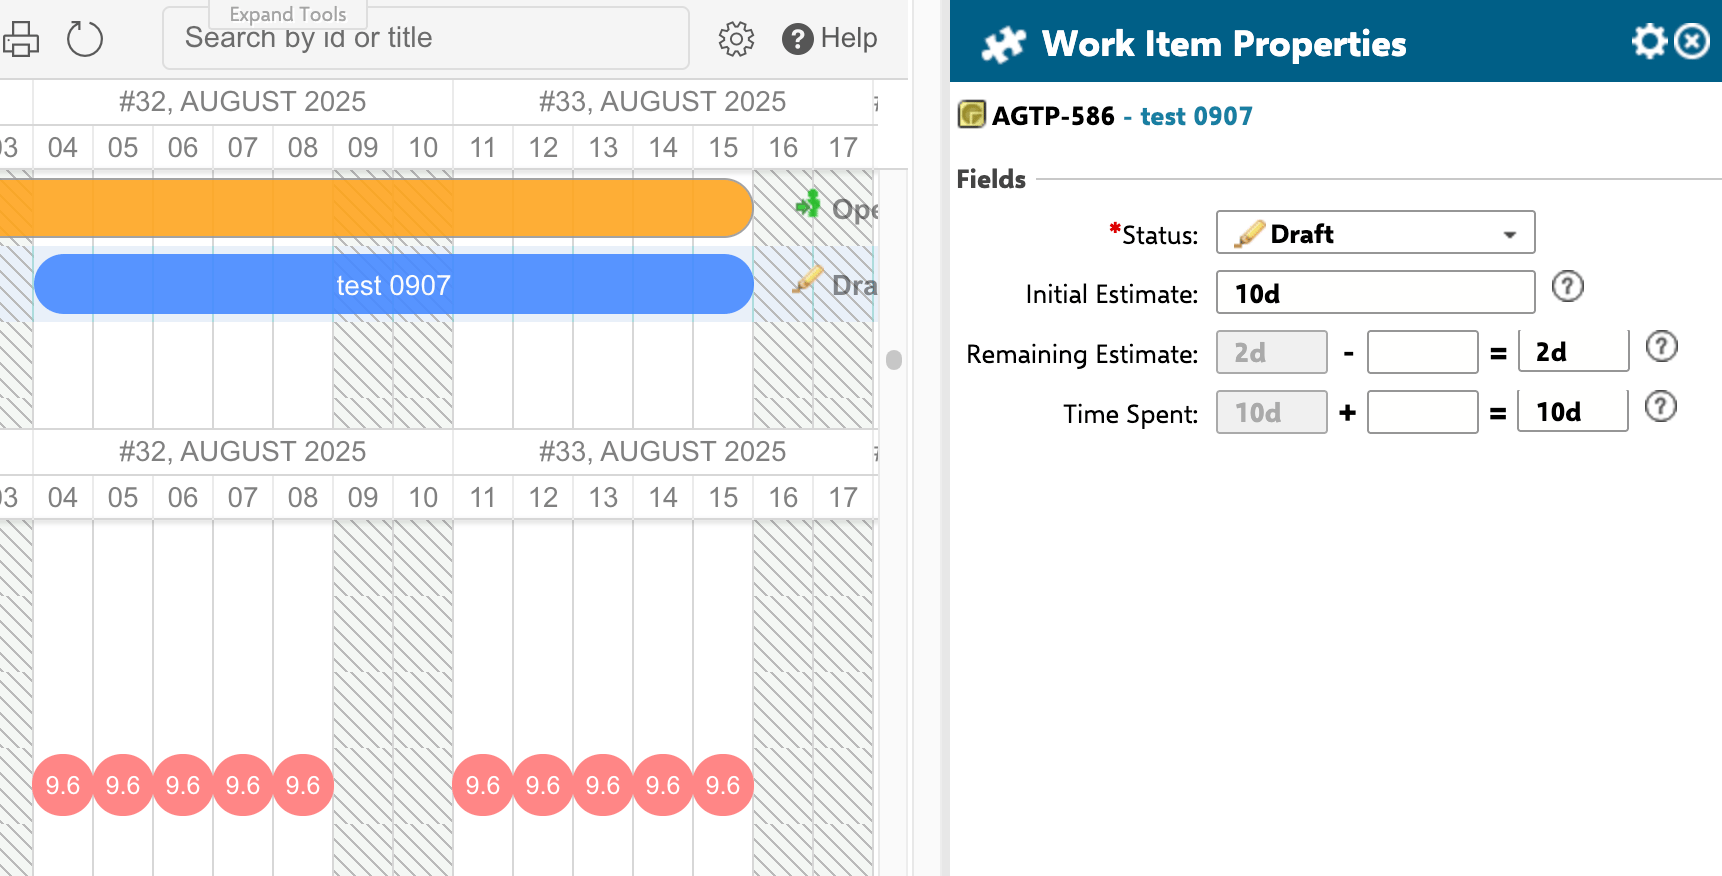
 When 96 hours of combined effort are spread across 10 scheduled days, the Resource View shows a daily load of 9.6 hours for the assigned user.
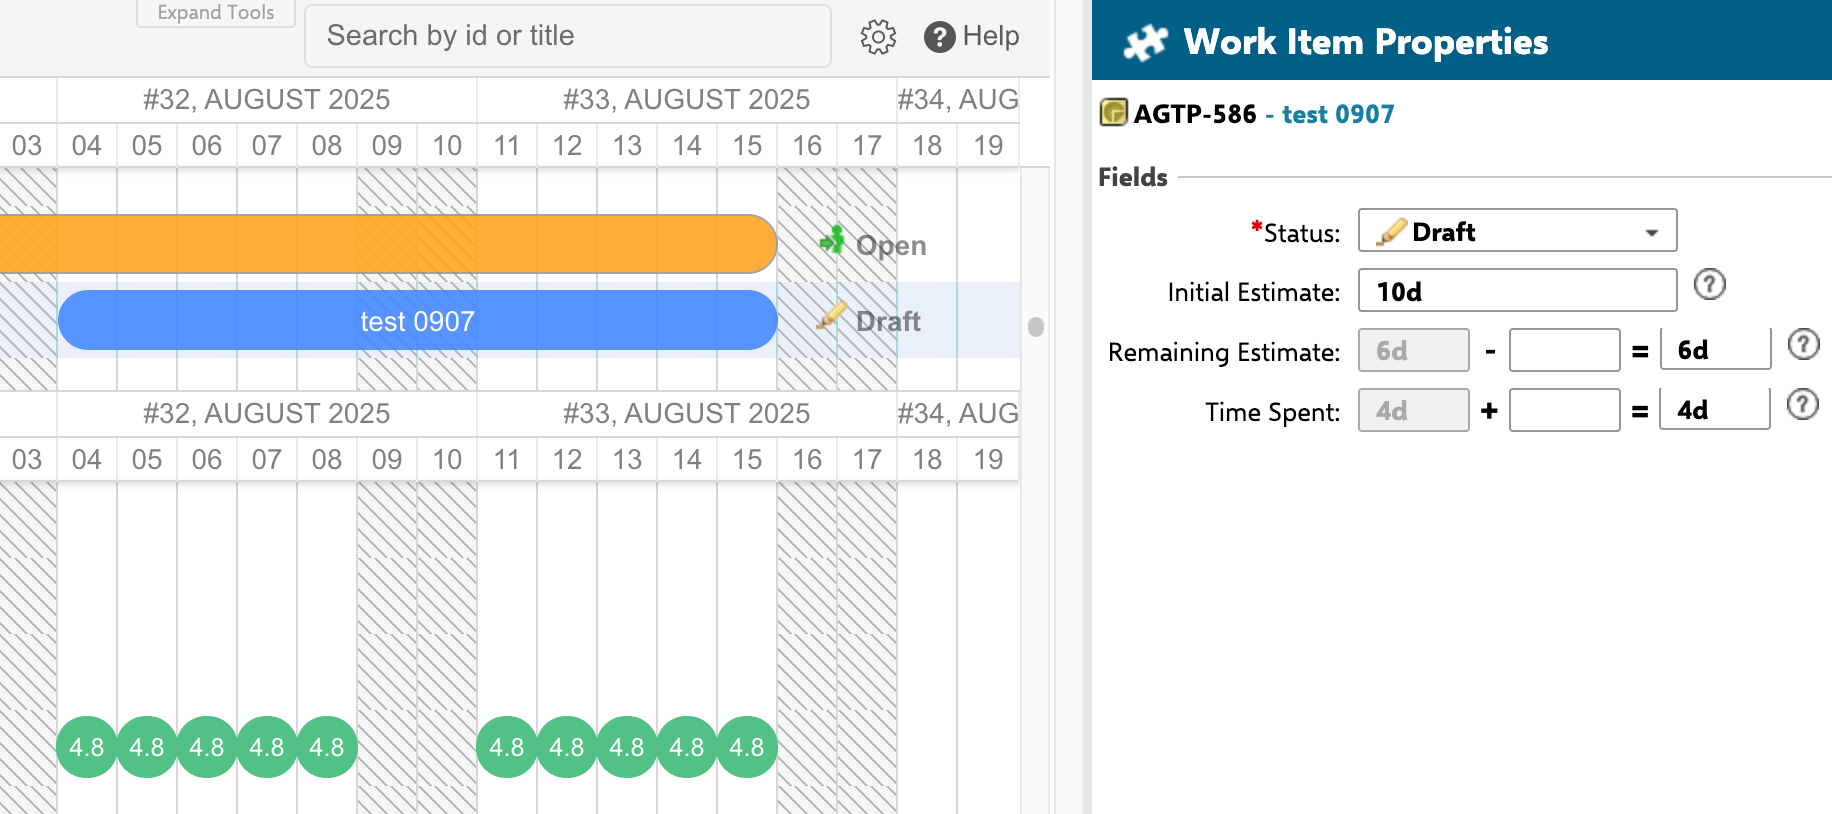
 **Remaining Estimate** distributes only the future remaining effort across scheduled days. A 6-day remaining estimate spread across 10 calendar days yields a workload of 4.8 hours per day.
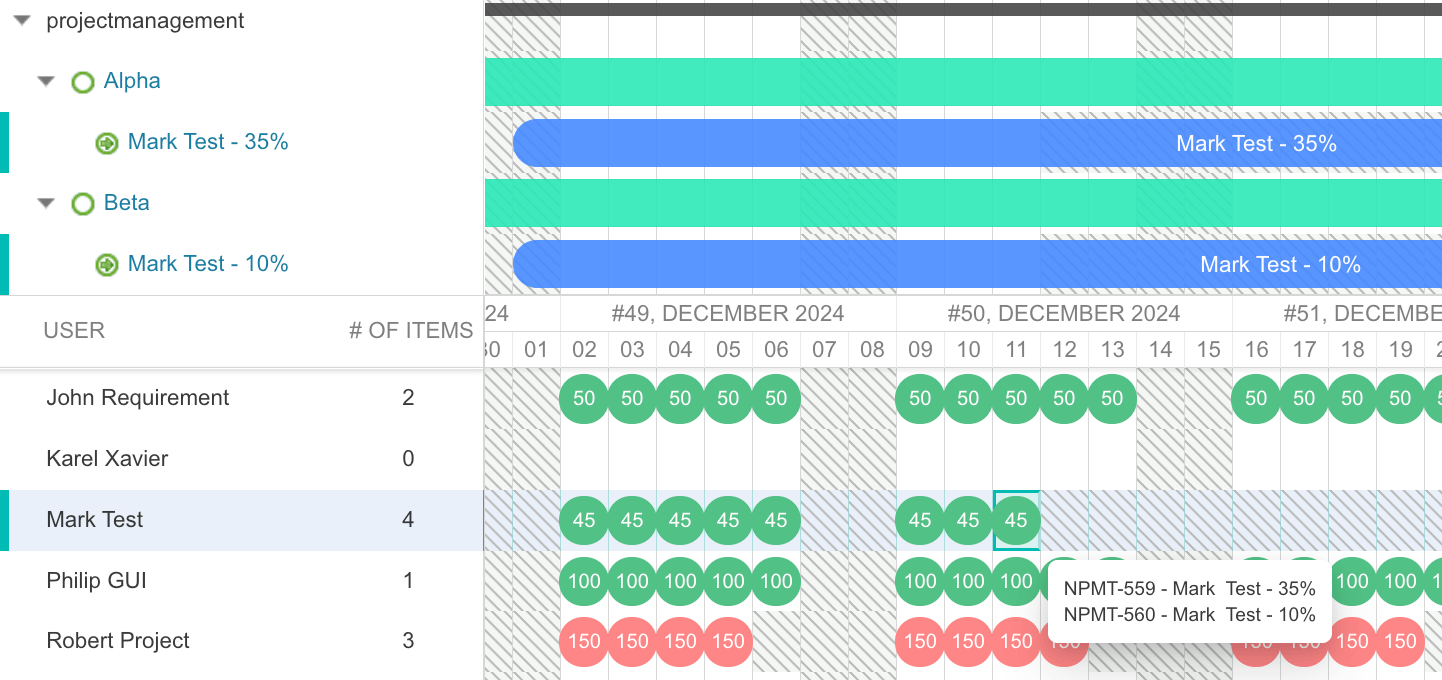
 **Assignment Allocation** shows percentage-based team allocation. A user assigned 35% in one team and 10% in another shows a combined 45% workload for that period; totals above 100% indicate overallocation.
 If your project tracks time spent, the Remaining Estimate mode gives you the most actionable view of outstanding work without inflating numbers with already-completed effort.
The resource load calculation considers work item resolution status, not just time fields. If a work item is resolved, it may be excluded from certain calculation modes. Use Remaining Estimate mode if resolved items appear to inflate numbers in Estimate + Spent mode.
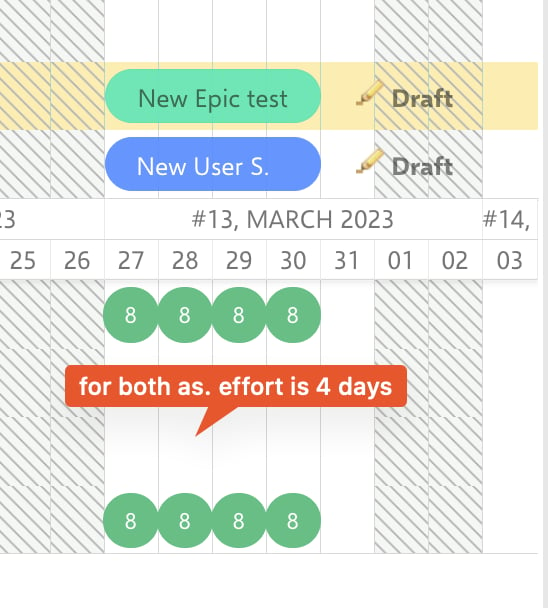
**Split the effort between multiple assignees.** By default, a task’s effort is shown in full for every assignee — a 4-day estimate appears as 4 days for each one.
If your project tracks time spent, the Remaining Estimate mode gives you the most actionable view of outstanding work without inflating numbers with already-completed effort.
The resource load calculation considers work item resolution status, not just time fields. If a work item is resolved, it may be excluded from certain calculation modes. Use Remaining Estimate mode if resolved items appear to inflate numbers in Estimate + Spent mode.
**Split the effort between multiple assignees.** By default, a task’s effort is shown in full for every assignee — a 4-day estimate appears as 4 days for each one.
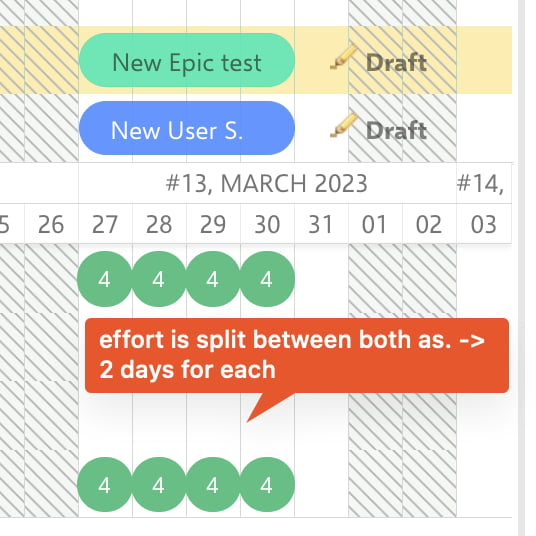
 To divide the effort equally between assignees instead, add `nextedy.gantt.multiAssignmentSameEffortForAll=false` to **Administration > Configuration Properties**.
 To see work items that have no resource assigned:
1. Set **Show Unassigned** to **Yes** in the Resource View parameters.
2. A dedicated row labeled "Unassigned" appears at the bottom of the resource view.
This helps you identify unallocated tasks during sprint or release planning.
**Show only users with tasks assigned.** Starting with version 24.1.1, the **Hide No Task Resources** button on the Gantt toolbar lets you collapse the list to resources that actually carry work. By default, all resources are shown.
To see work items that have no resource assigned:
1. Set **Show Unassigned** to **Yes** in the Resource View parameters.
2. A dedicated row labeled "Unassigned" appears at the bottom of the resource view.
This helps you identify unallocated tasks during sprint or release planning.
**Show only users with tasks assigned.** Starting with version 24.1.1, the **Hide No Task Resources** button on the Gantt toolbar lets you collapse the list to resources that actually carry work. By default, all resources are shown.
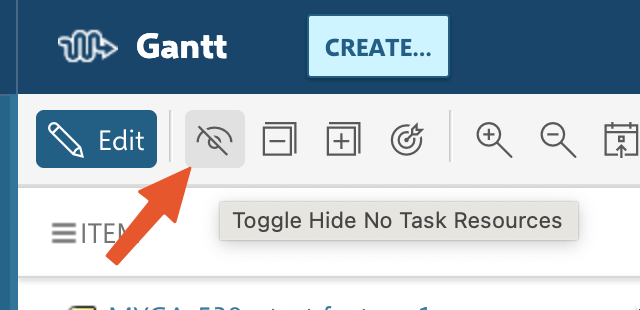
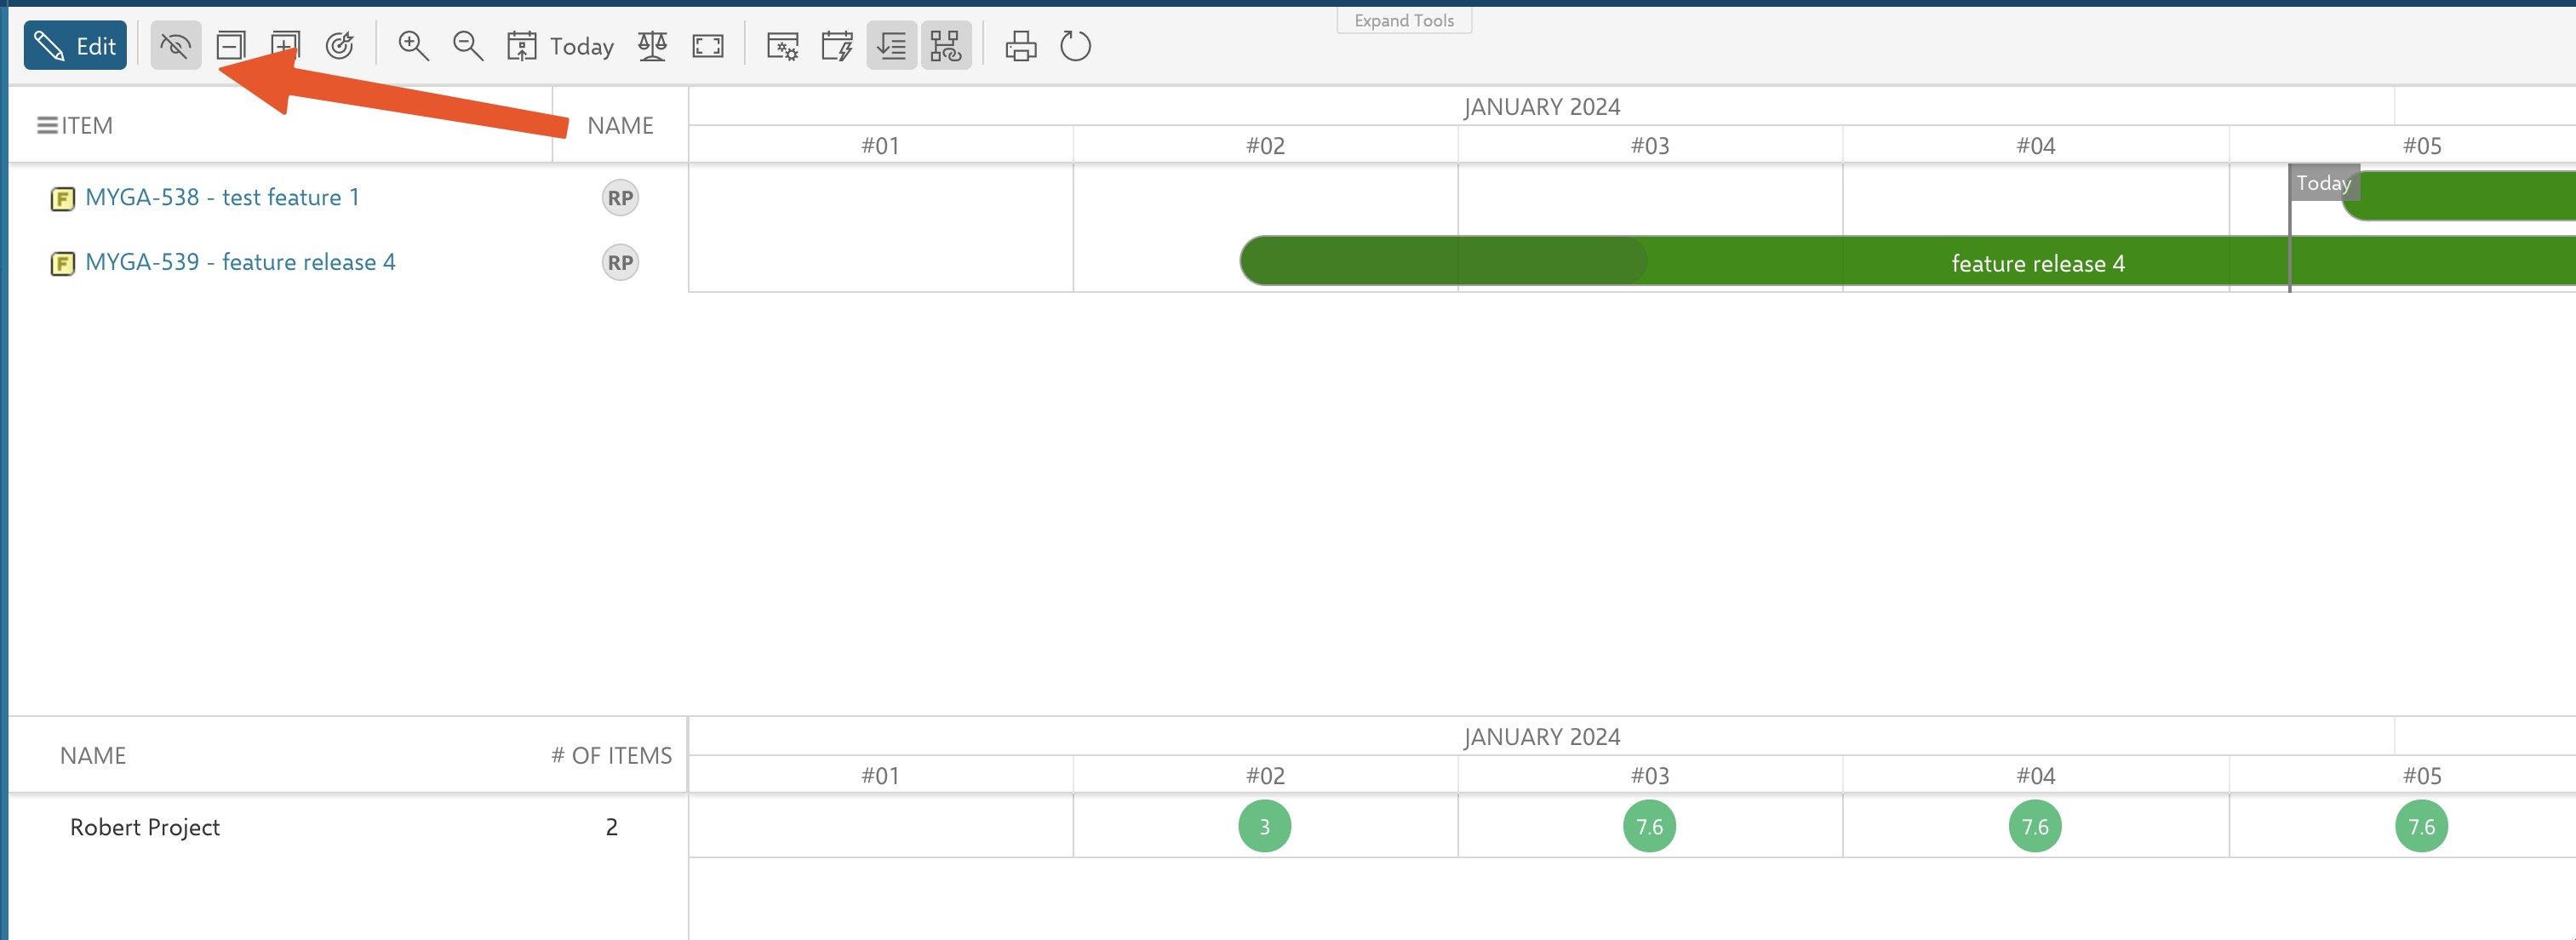
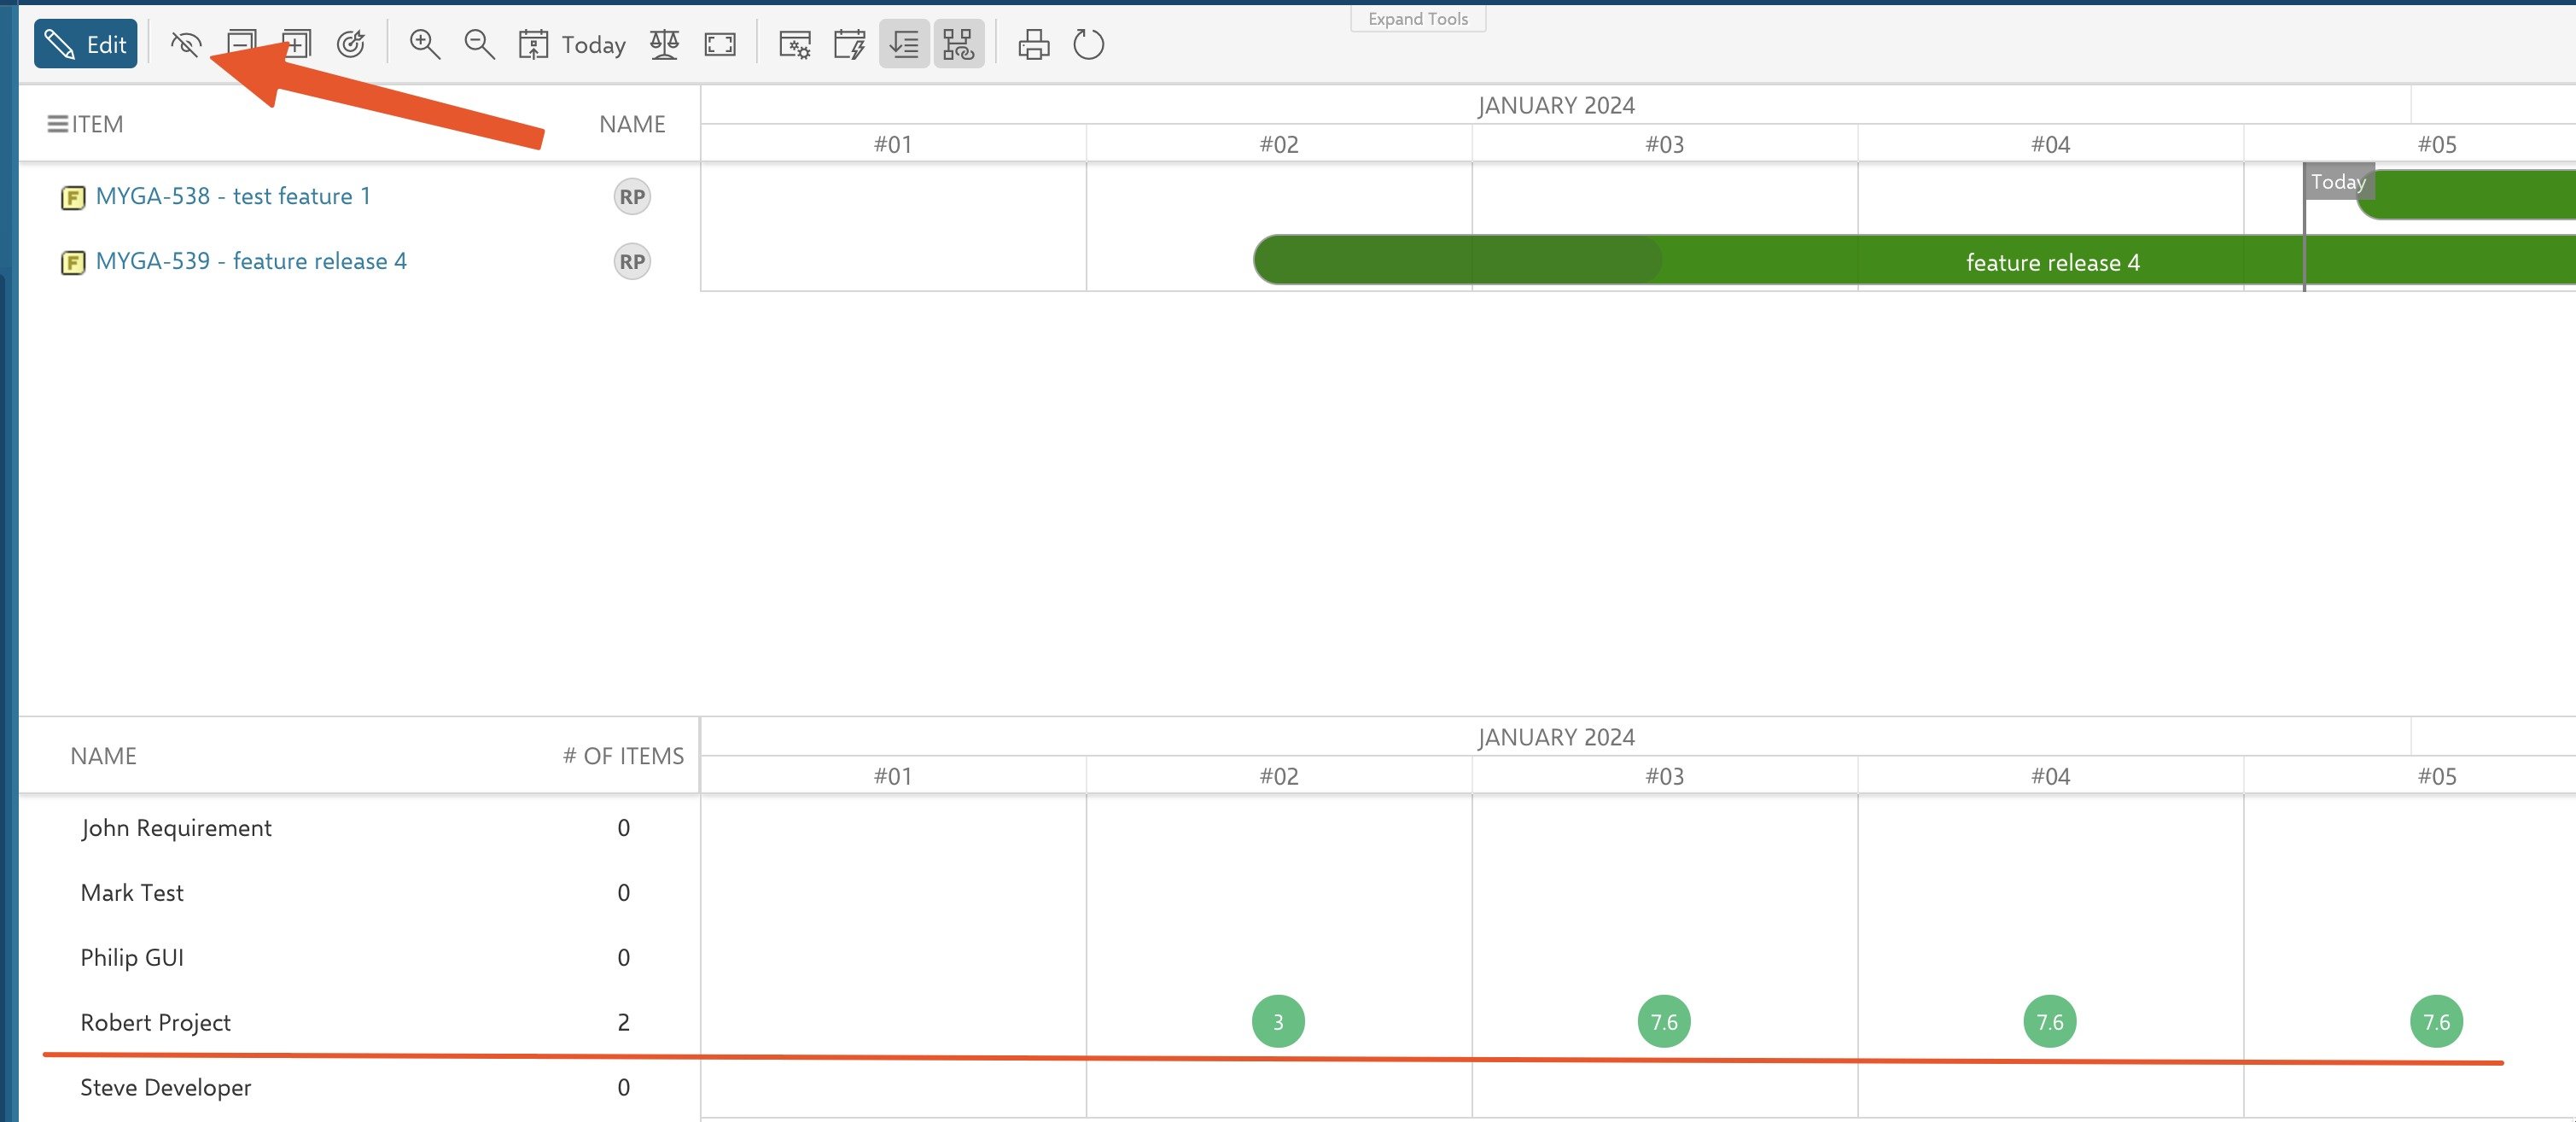 Toggling the button hides every resource that has no tasks from the Gantt page.
 You can set the initial panel height via the **View Height** parameter. After the Gantt loads, you can also resize the resource view by dragging the horizontal divider between the Gantt chart and the resource view.
Resource allocation markers use color coding to indicate capacity status:
* **Green** cells indicate the resource is within capacity
* **Red** cells indicate the resource is overallocated
The default scheme uses green for acceptable allocation and red for overallocation.
You can set the initial panel height via the **View Height** parameter. After the Gantt loads, you can also resize the resource view by dragging the horizontal divider between the Gantt chart and the resource view.
Resource allocation markers use color coding to indicate capacity status:
* **Green** cells indicate the resource is within capacity
* **Red** cells indicate the resource is overallocated
The default scheme uses green for acceptable allocation and red for overallocation.
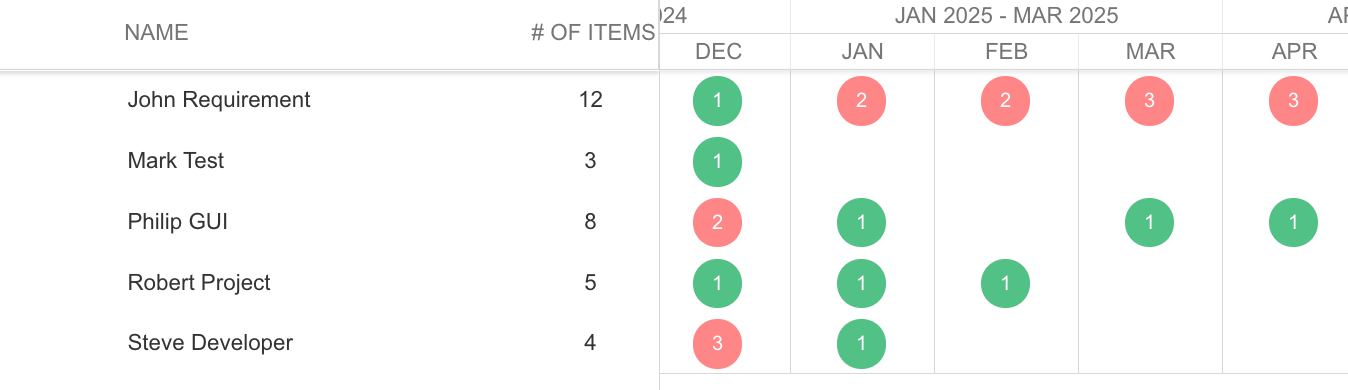 You can customize these bubbles for a clearer, more intuitive allocation overview.
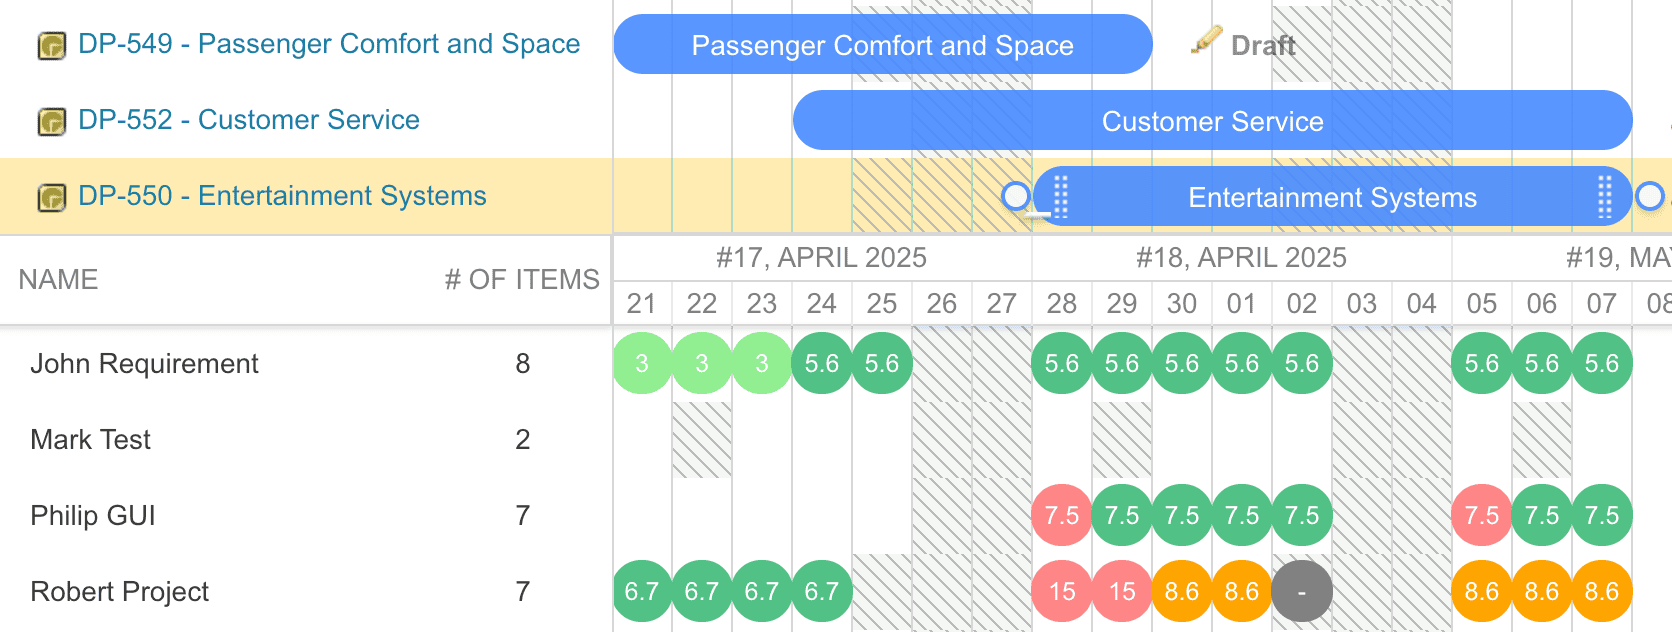
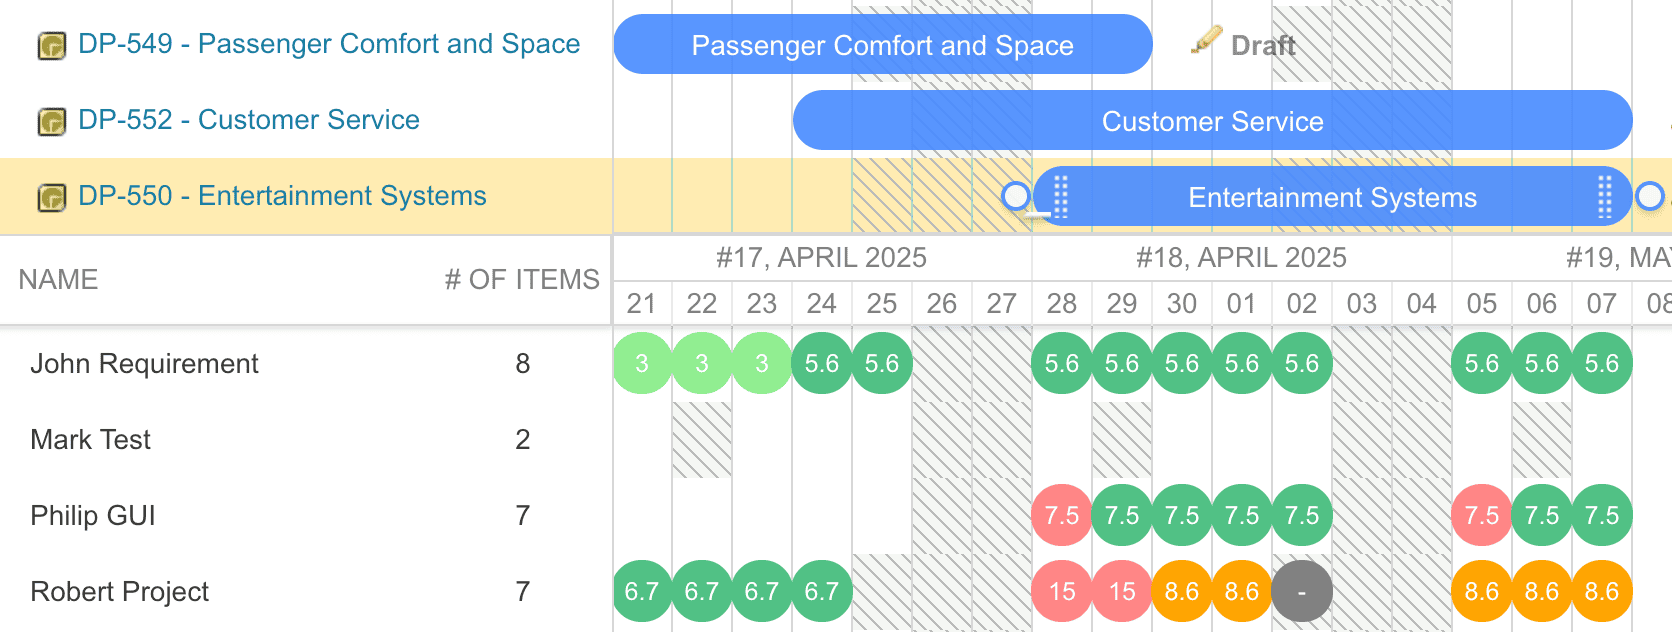 With the dynamic approach, you define color thresholds via the Gantt Config Script or Configuration Properties — for example, lightgreen up to 50%, `#51c185` up to 100%, orange up to 150%, and `#ff8686` above 150%.
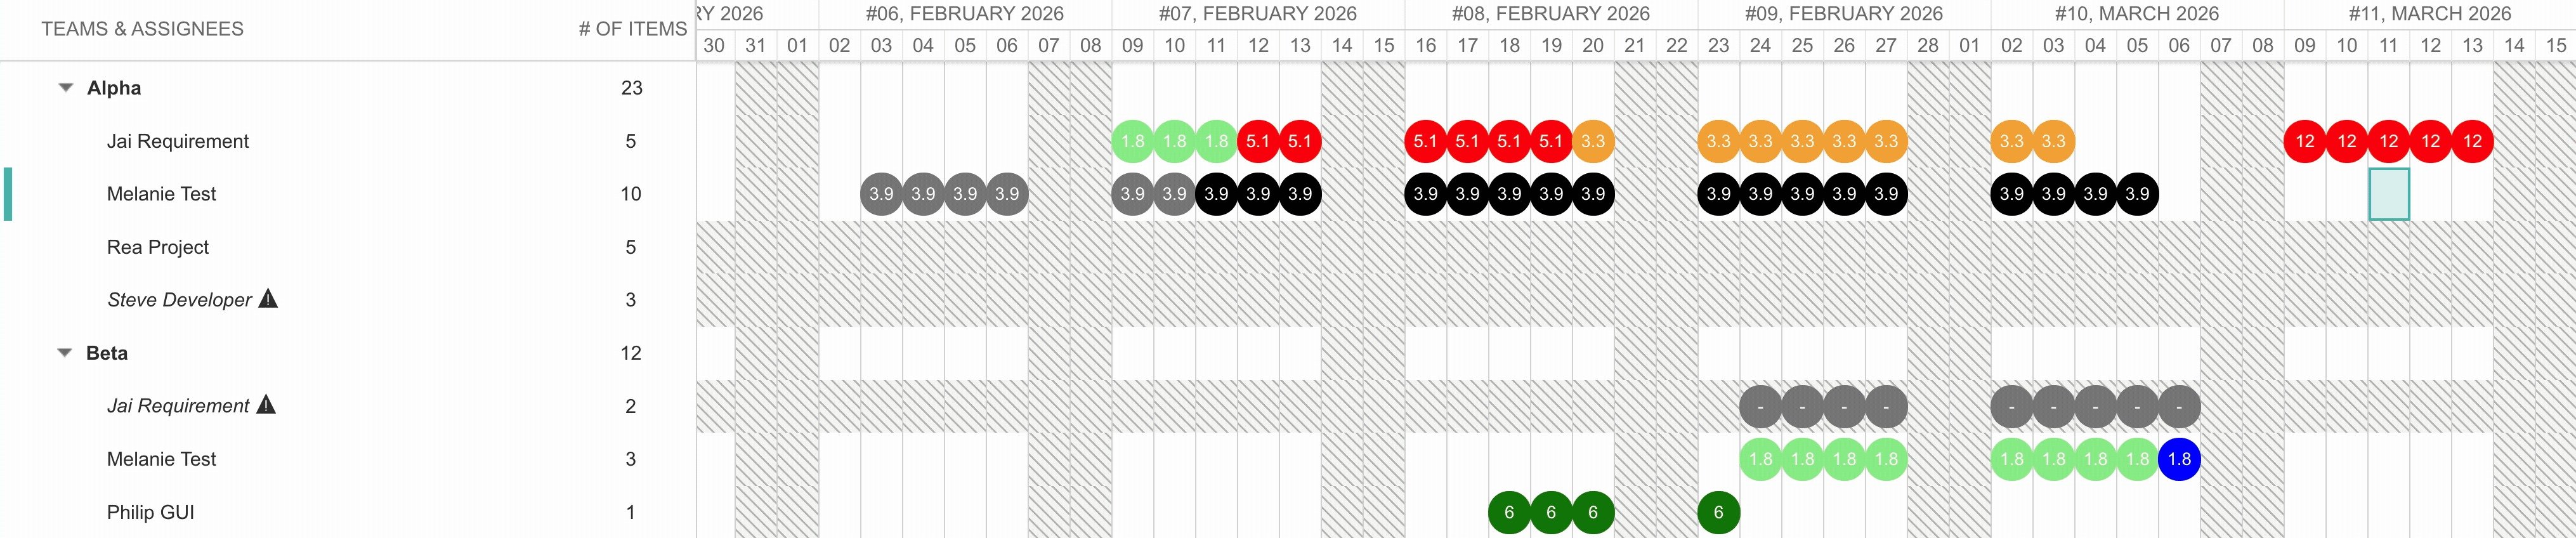
 Team overallocation color schemes let you distinguish global overload from in-team overload. Since version 25.4.1, this also works when defined via Configuration Properties at project or global level.
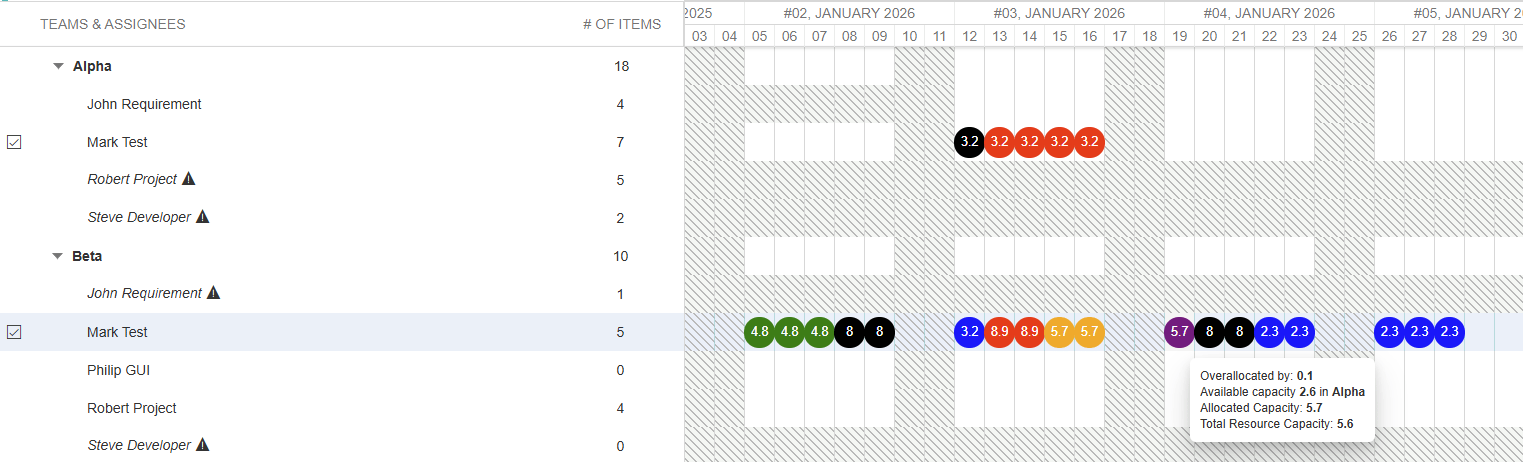 With the static approach, a Script Block widget overrides the OK marker (default green bubble) and the overloaded marker (default red bubble) so you can apply any background-color and color combination.
The static CSS approach applies to **Leaf Items Count** and **Assignment Allocation** modes. For **Estimate + Spent** and **Remaining Estimate** modes, use the dynamic `resourceMarkersColorConfig` approach instead.
With the static approach, a Script Block widget overrides the OK marker (default green bubble) and the overloaded marker (default red bubble) so you can apply any background-color and color combination.
The static CSS approach applies to **Leaf Items Count** and **Assignment Allocation** modes. For **Estimate + Spent** and **Remaining Estimate** modes, use the dynamic `resourceMarkersColorConfig` approach instead.
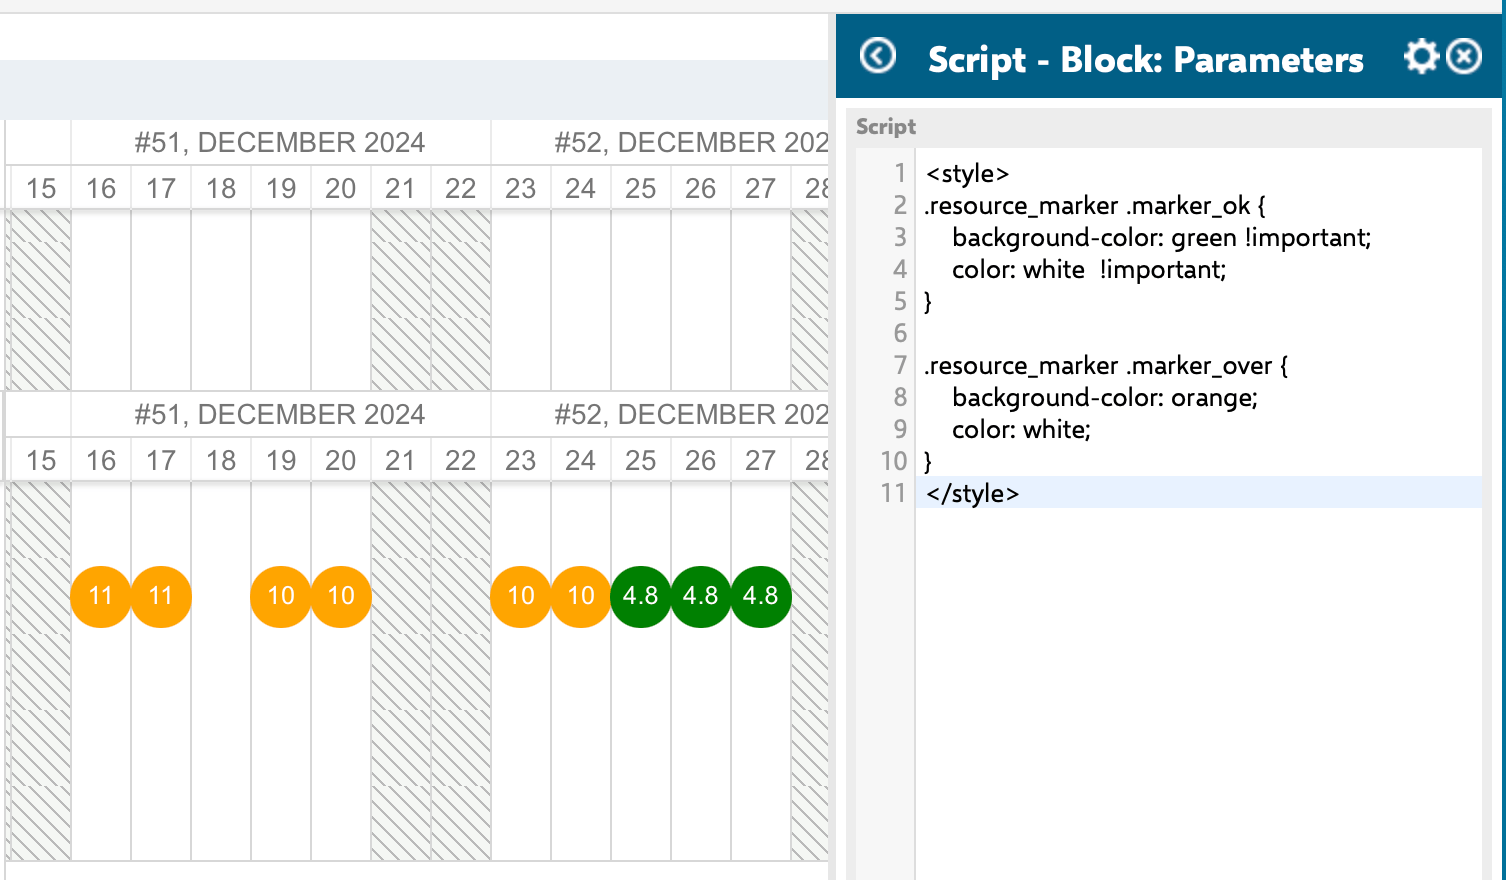 For full instructions, see [Configure Resource Allocation Marker Colors](/gantt/guides/visualization/resource-marker-colors).
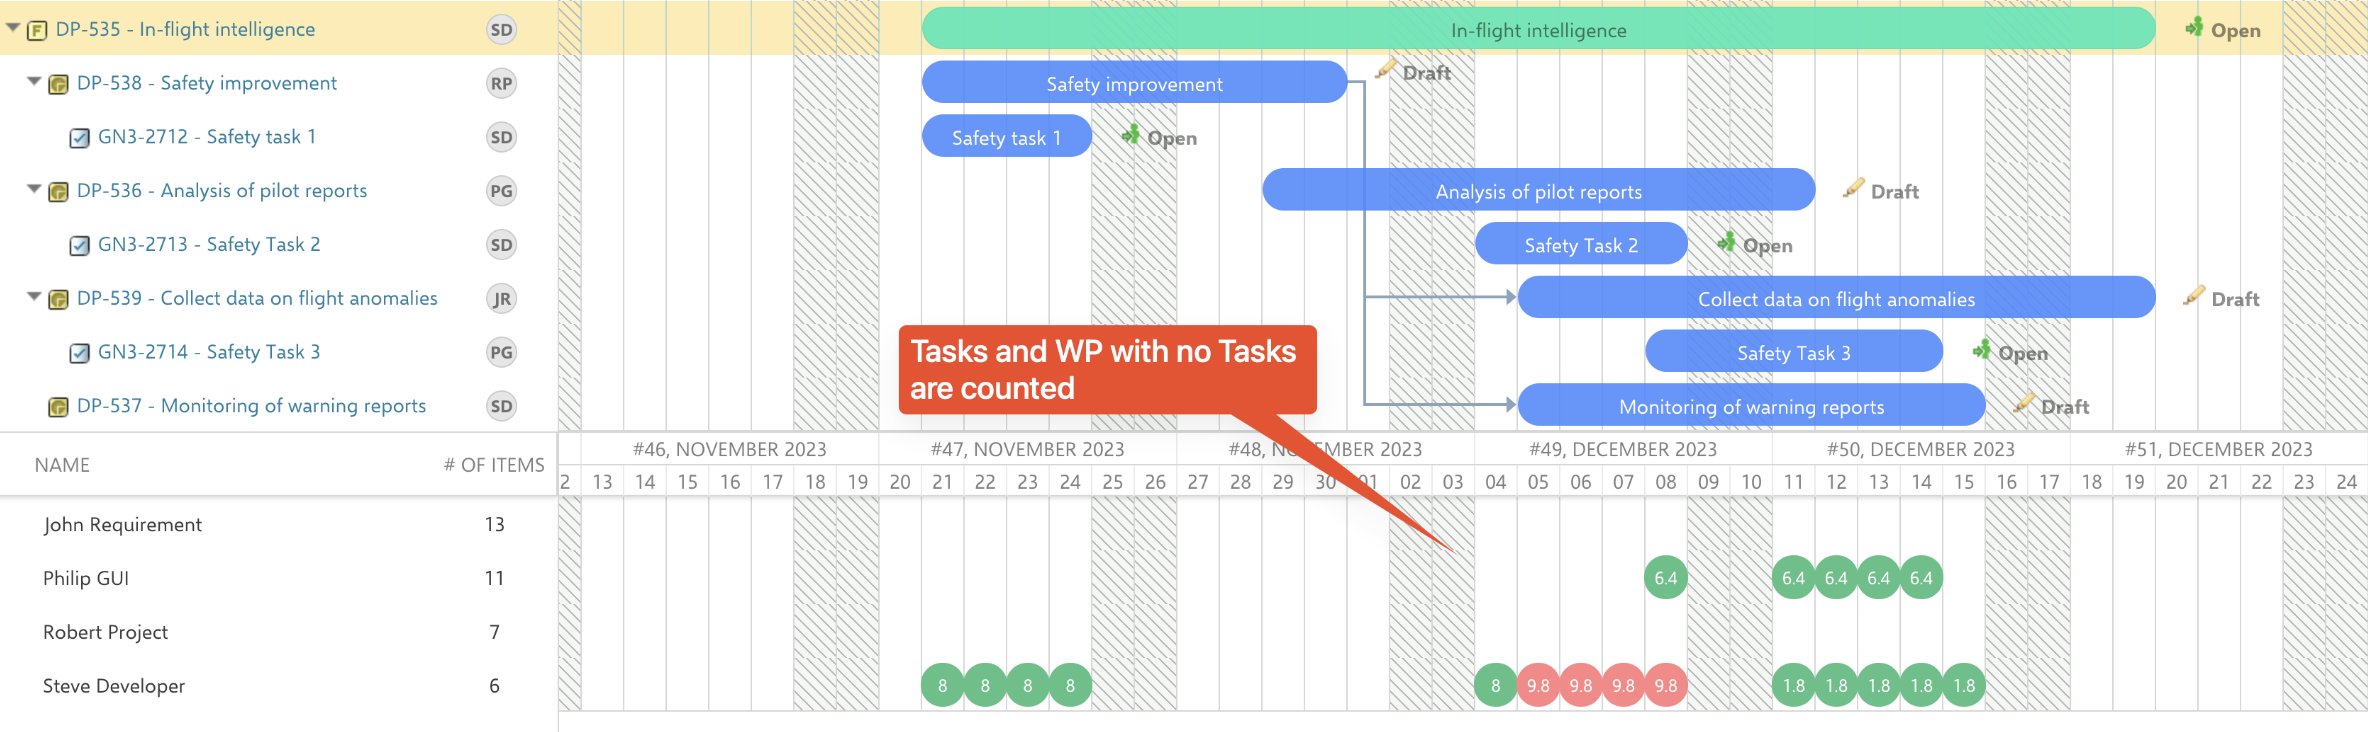
When using Leaf Items Count mode, only leaf-level work items (those with no children) are counted. If you enable `onlyLeafTasks`, parent summary tasks are excluded from both the Gantt display and resource calculations.
Only Tasks and Work Packages that have no child items are counted as load for their assignees, so real, hands-on work is counted once per user and parent items are not double-counted.
For full instructions, see [Configure Resource Allocation Marker Colors](/gantt/guides/visualization/resource-marker-colors).
When using Leaf Items Count mode, only leaf-level work items (those with no children) are counted. If you enable `onlyLeafTasks`, parent summary tasks are excluded from both the Gantt display and resource calculations.
Only Tasks and Work Packages that have no child items are counted as load for their assignees, so real, hands-on work is counted once per user and parent items are not double-counted.
 To count higher-level items as well — useful when you intentionally track effort at multiple levels — set `nextedy.gantt.config.onlyLeafTasks=false` in **Widget Properties > Gantt Config Script**.
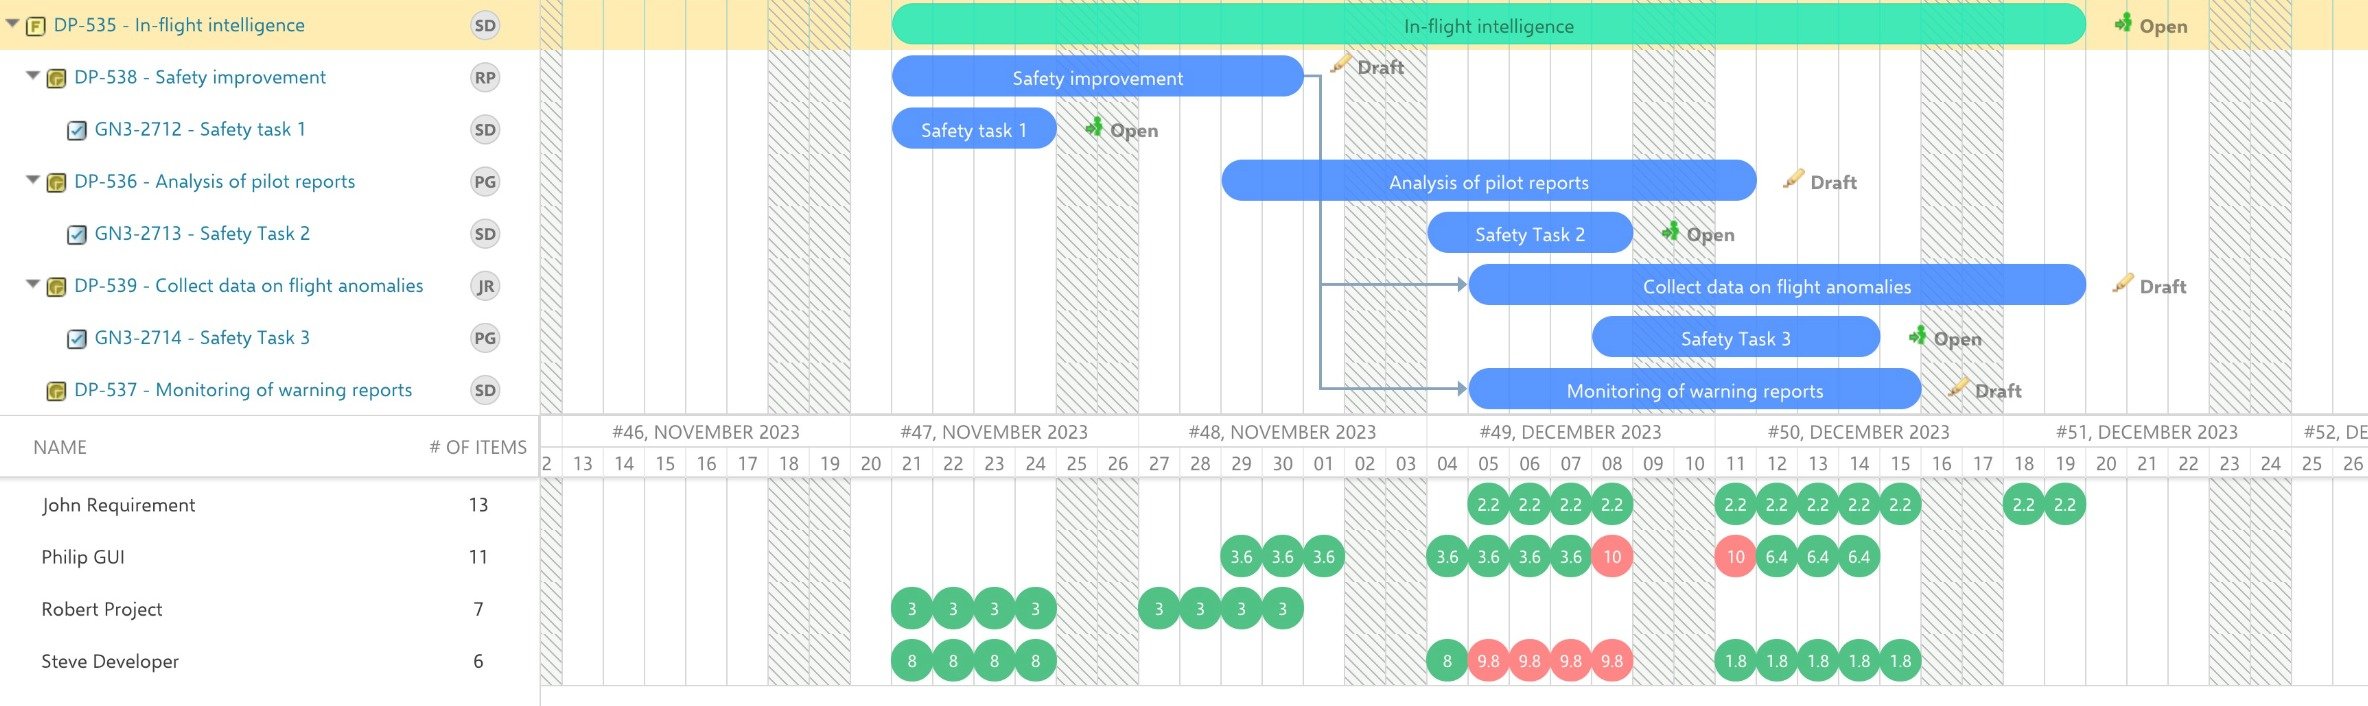 With that setting, all items are counted in the Resource View.
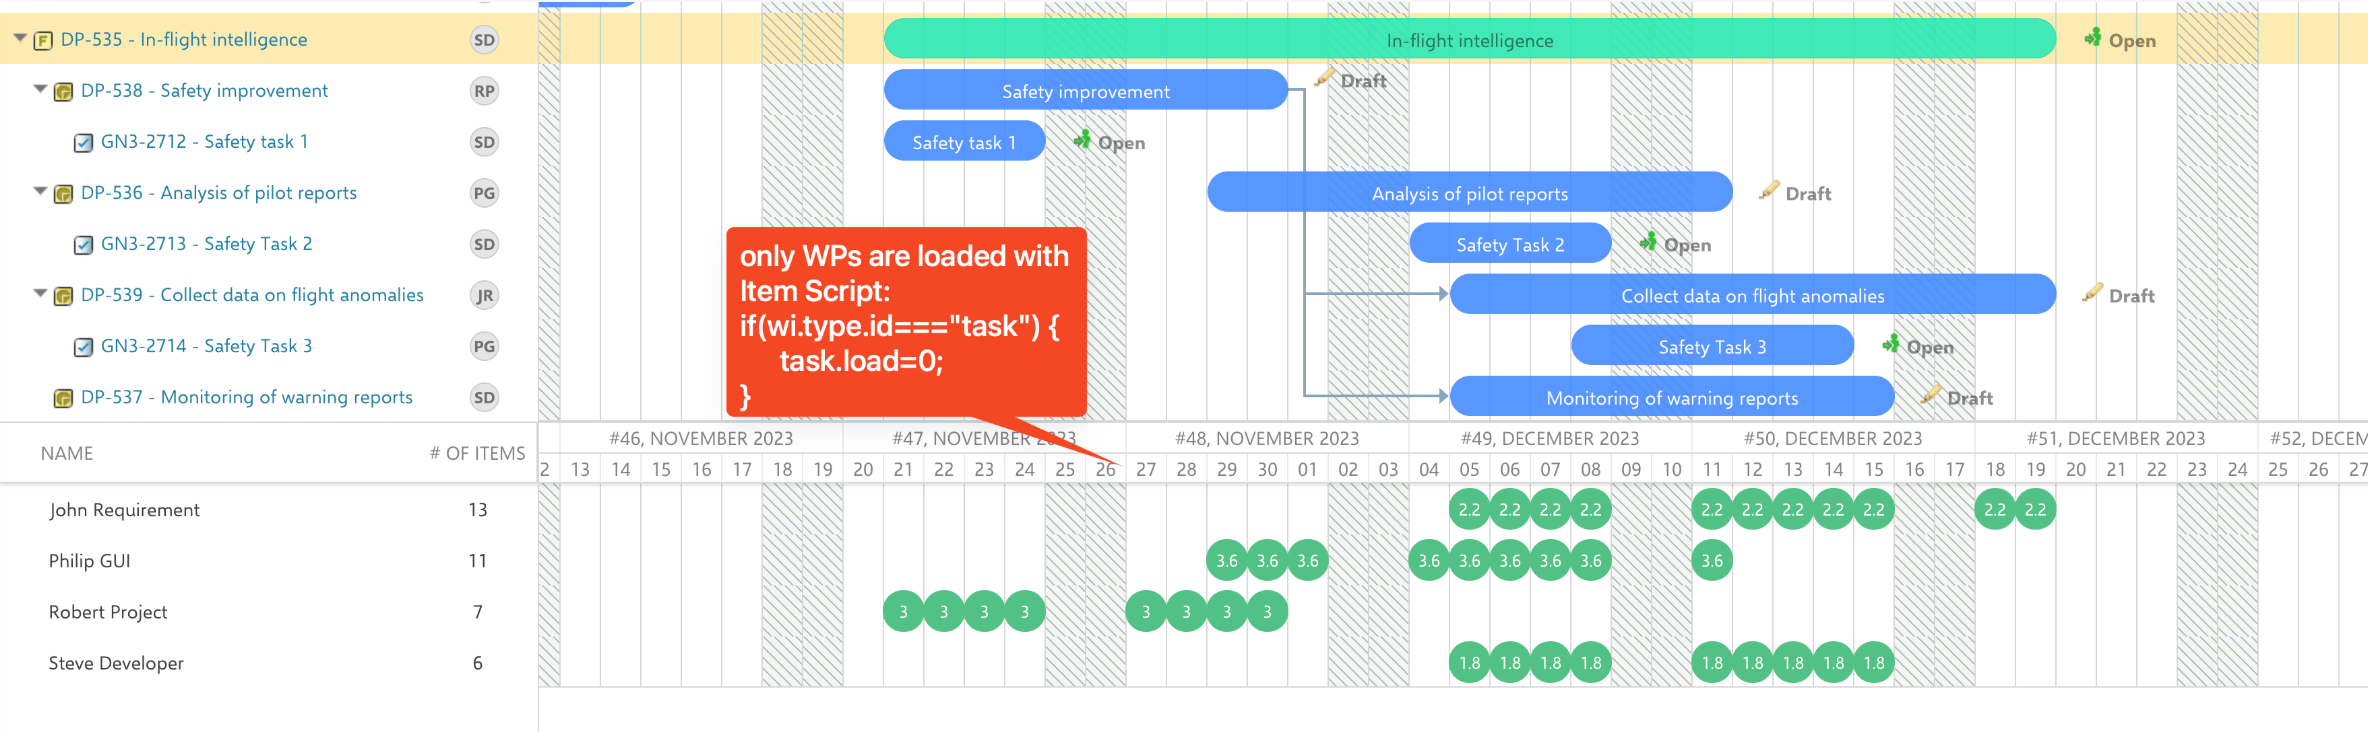
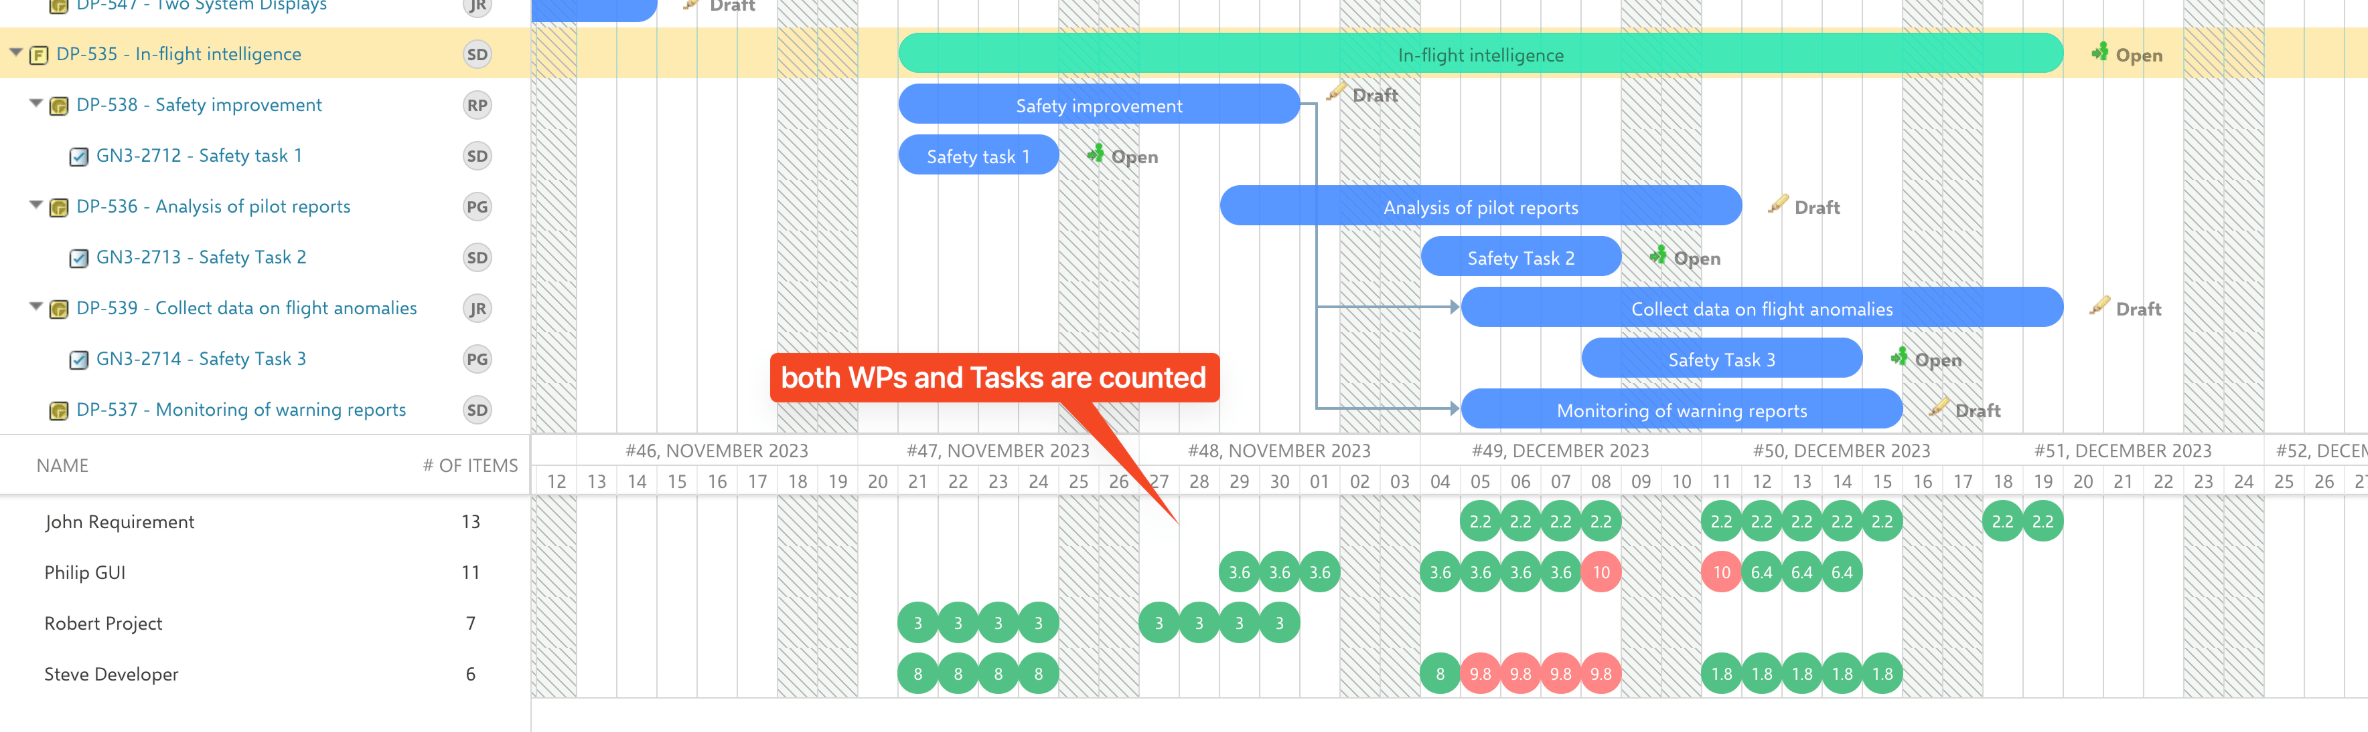 To skip specific tasks from the calculation — for example, keeping only Work Packages — add a rule to the Item Script such as `if(wi.getType().getId()==="task") { task.load=0; }`.
 You can also calculate Resource Load globally while showing only the project timeline, so the load counts items from other projects too.
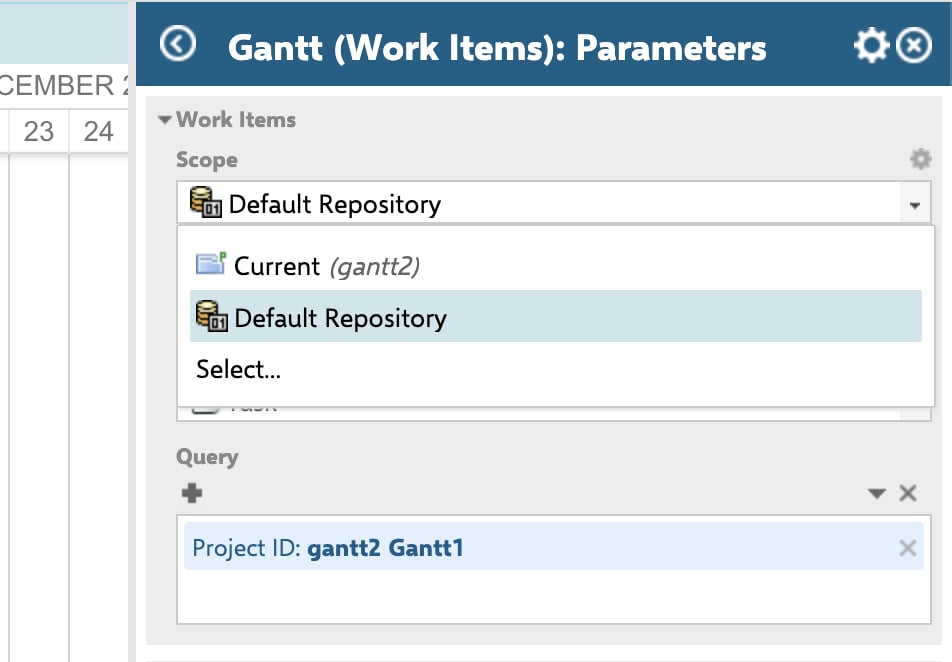
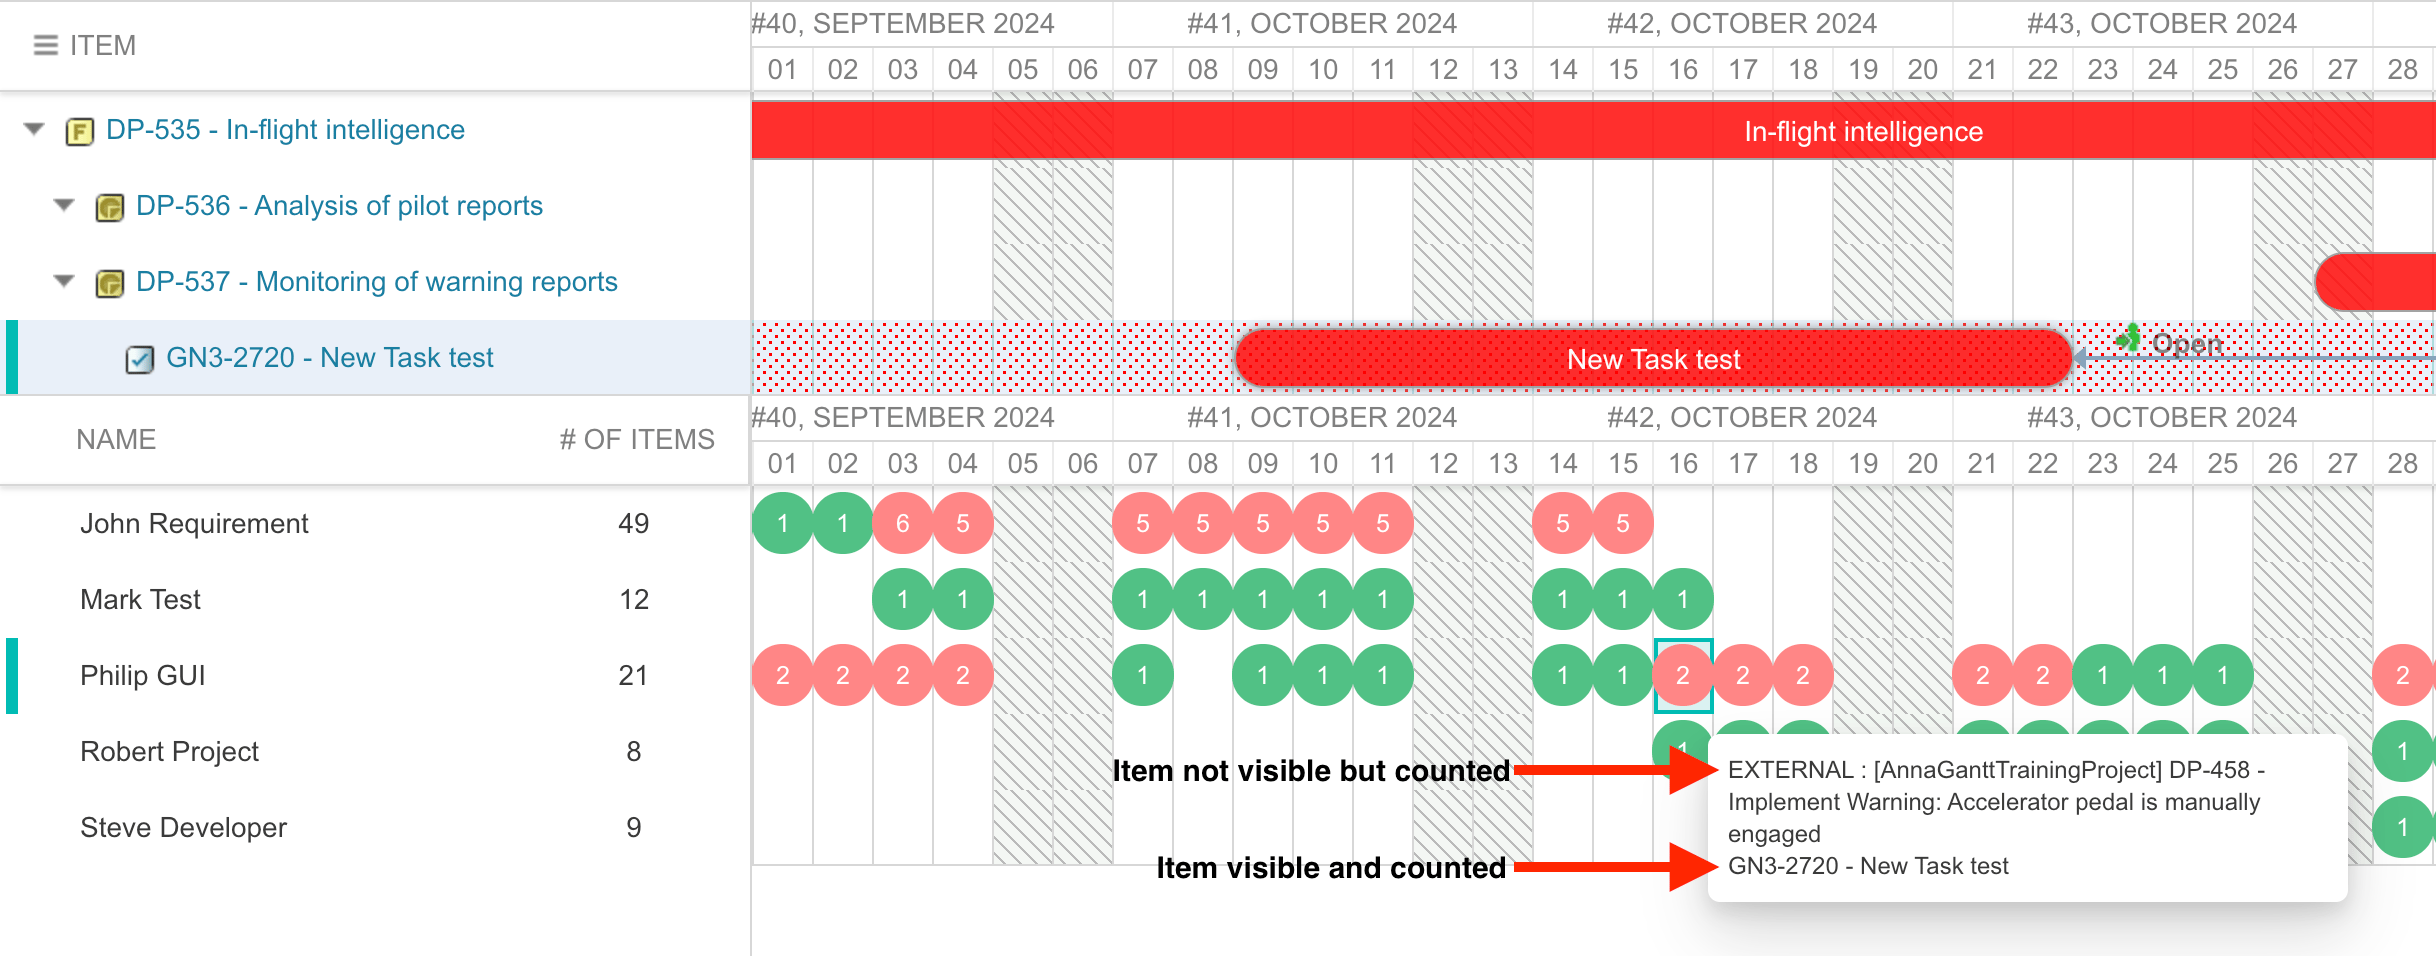 Achieve this by querying items from multiple projects.
 ## Verification
You should now see:
* A resource view panel below the Gantt chart with one row per assigned resource
* Workload values in each cell matching your chosen calculation mode
* Color-coded cells indicating within-capacity (green) and overallocation (red) states
## See Also
* [Configure Resource Fields](/gantt/guides/resources/resource-field-configuration)
* [Set Up a Cross-Team Gantt Chart](/gantt/guides/resources/cross-team-gantt)
* [Hide Inactive Resources](/gantt/guides/resources/resource-hiding)
* [Configure Resource Allocation Marker Colors](/gantt/guides/visualization/resource-marker-colors)
* [Filter by Resource and Allocation](/gantt/guides/filtering/filter-by-resource)
## Verification
You should now see:
* A resource view panel below the Gantt chart with one row per assigned resource
* Workload values in each cell matching your chosen calculation mode
* Color-coded cells indicating within-capacity (green) and overallocation (red) states
## See Also
* [Configure Resource Fields](/gantt/guides/resources/resource-field-configuration)
* [Set Up a Cross-Team Gantt Chart](/gantt/guides/resources/cross-team-gantt)
* [Hide Inactive Resources](/gantt/guides/resources/resource-hiding)
* [Configure Resource Allocation Marker Colors](/gantt/guides/visualization/resource-marker-colors)
* [Filter by Resource and Allocation](/gantt/guides/filtering/filter-by-resource)