> ## Documentation Index
> Fetch the complete documentation index at: https://learn.nextedy.com/llms.txt
> Use this file to discover all available pages before exploring further.
# Use Gantt Filters
> This guide shows you how to apply item, resource, time range, and allocation filters in Nextedy GANTT to focus the chart on the work items that matter most.
export const LastReviewed = ({date}) => {
if (!date) return null;
const formatted = new Date(`${date}T00:00:00Z`).toLocaleDateString("en-US", {
year: "numeric",
month: "long",
day: "numeric",
timeZone: "UTC"
});
return
Last reviewed on {formatted}
;
};
## Filter Types Overview
| Filter Type | Trigger | Available Since |
| --------------------------- | ------------------------------------------ | --------------- |
| Time range | Gantt Config Script | All versions |
| Filter by item | Select items, then click toolbar button | 25.4.1 |
| Filter by resource | Click a resource name in the resource view | 25.4.1 |
| Filter by allocation bubble | Click an allocation marker cell | 25.4.1 |
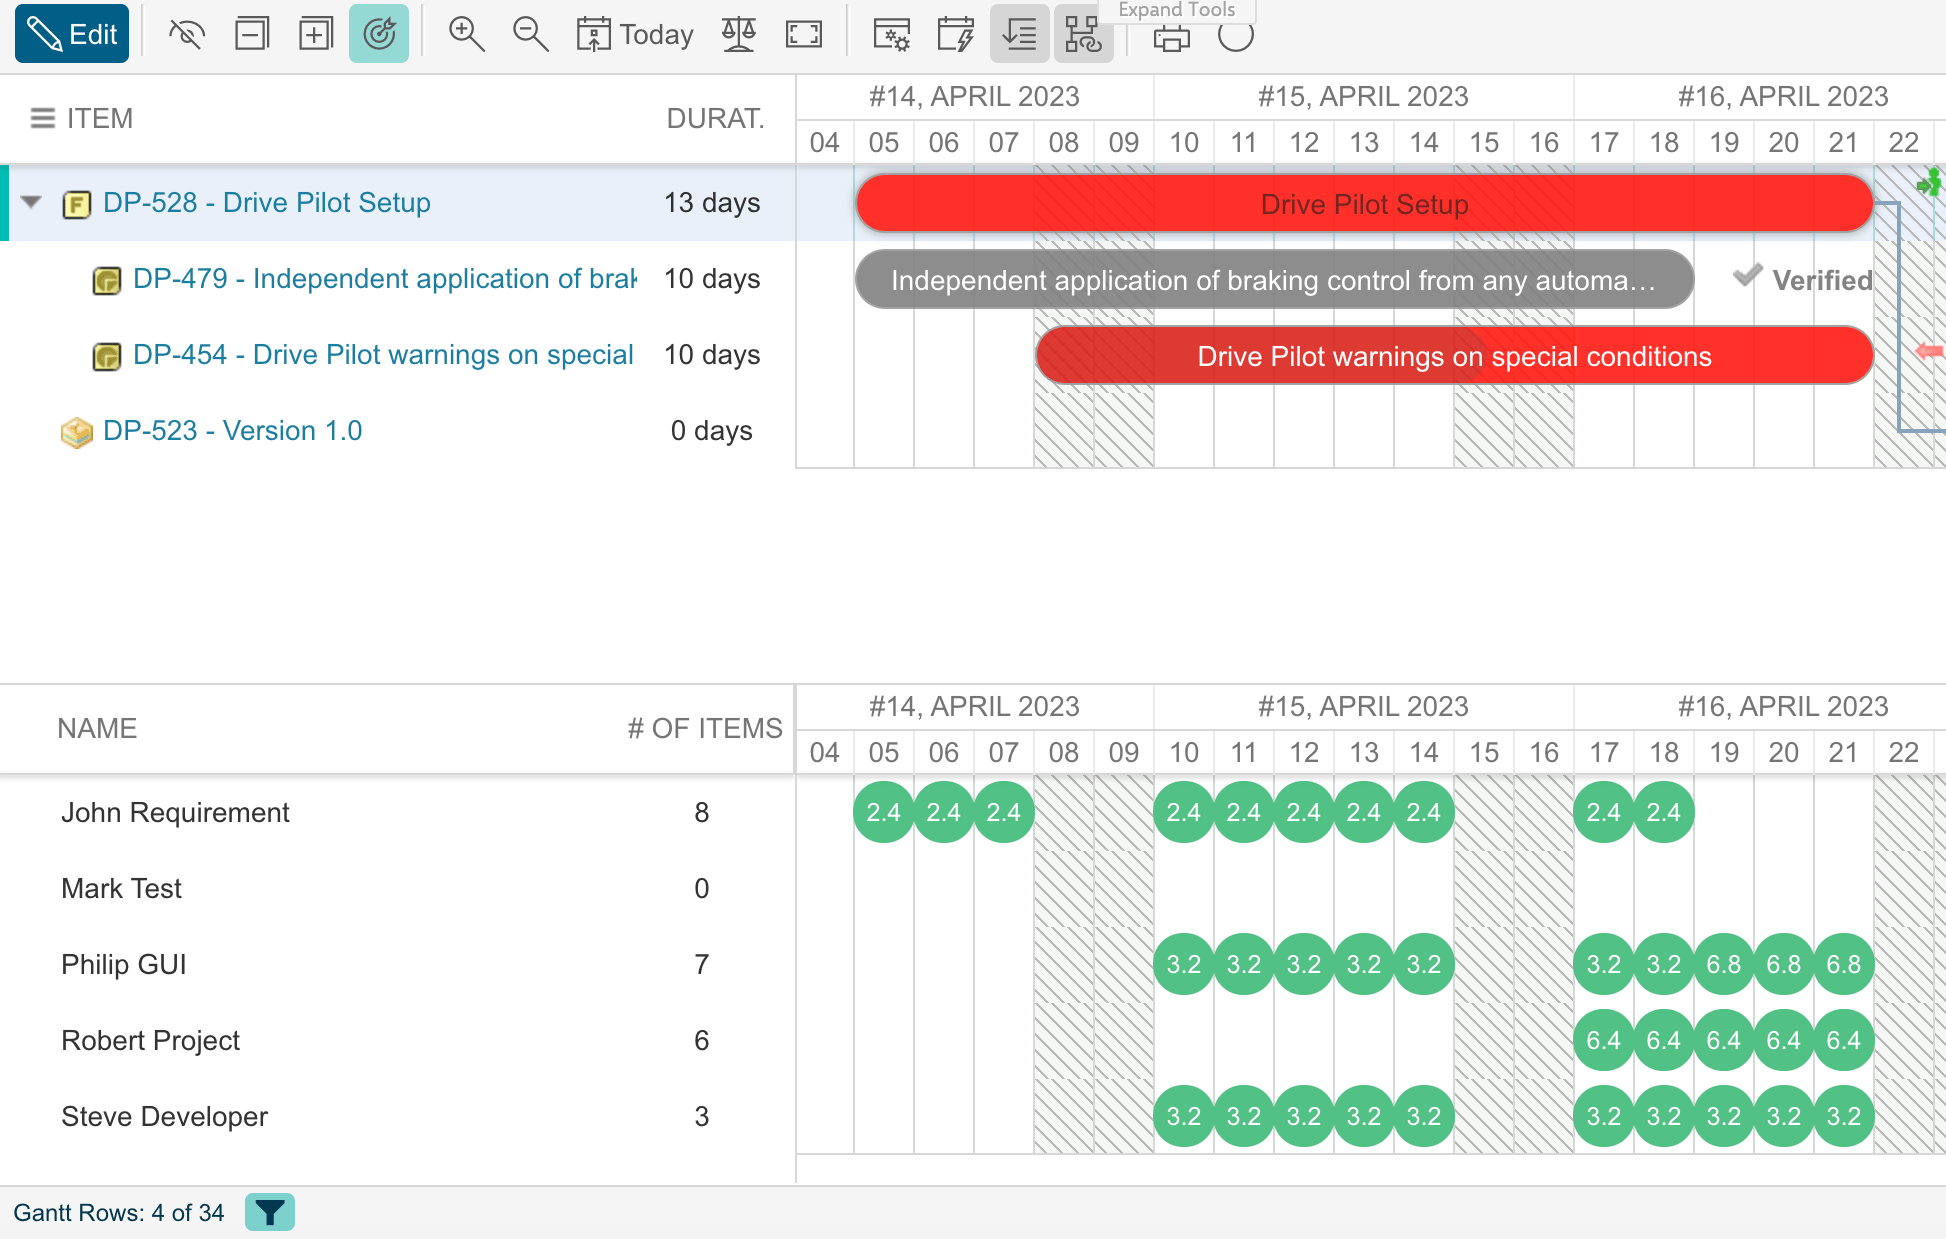 When any filter is active, a **funnel icon** appears in the Gantt footer. Hover over the funnel icon to see a tooltip describing the currently applied filter (time range, by item, resource, or allocation).
 ## Filter by Time Range
Set a fixed time range in **Advanced > Gantt Config Script** to limit which work items are visible on the chart:
```javascript theme={null}
gantt.config.start_date = new Date(2024, 11, 10);
gantt.config.end_date = new Date(2025, 7, 20);
```
In JavaScript `Date` objects, months start at 0 (January = 0, December = 11). The example above sets the range from **10 December 2024** to **20 August 2025**.
### Use Page Parameters for Dynamic Time Ranges
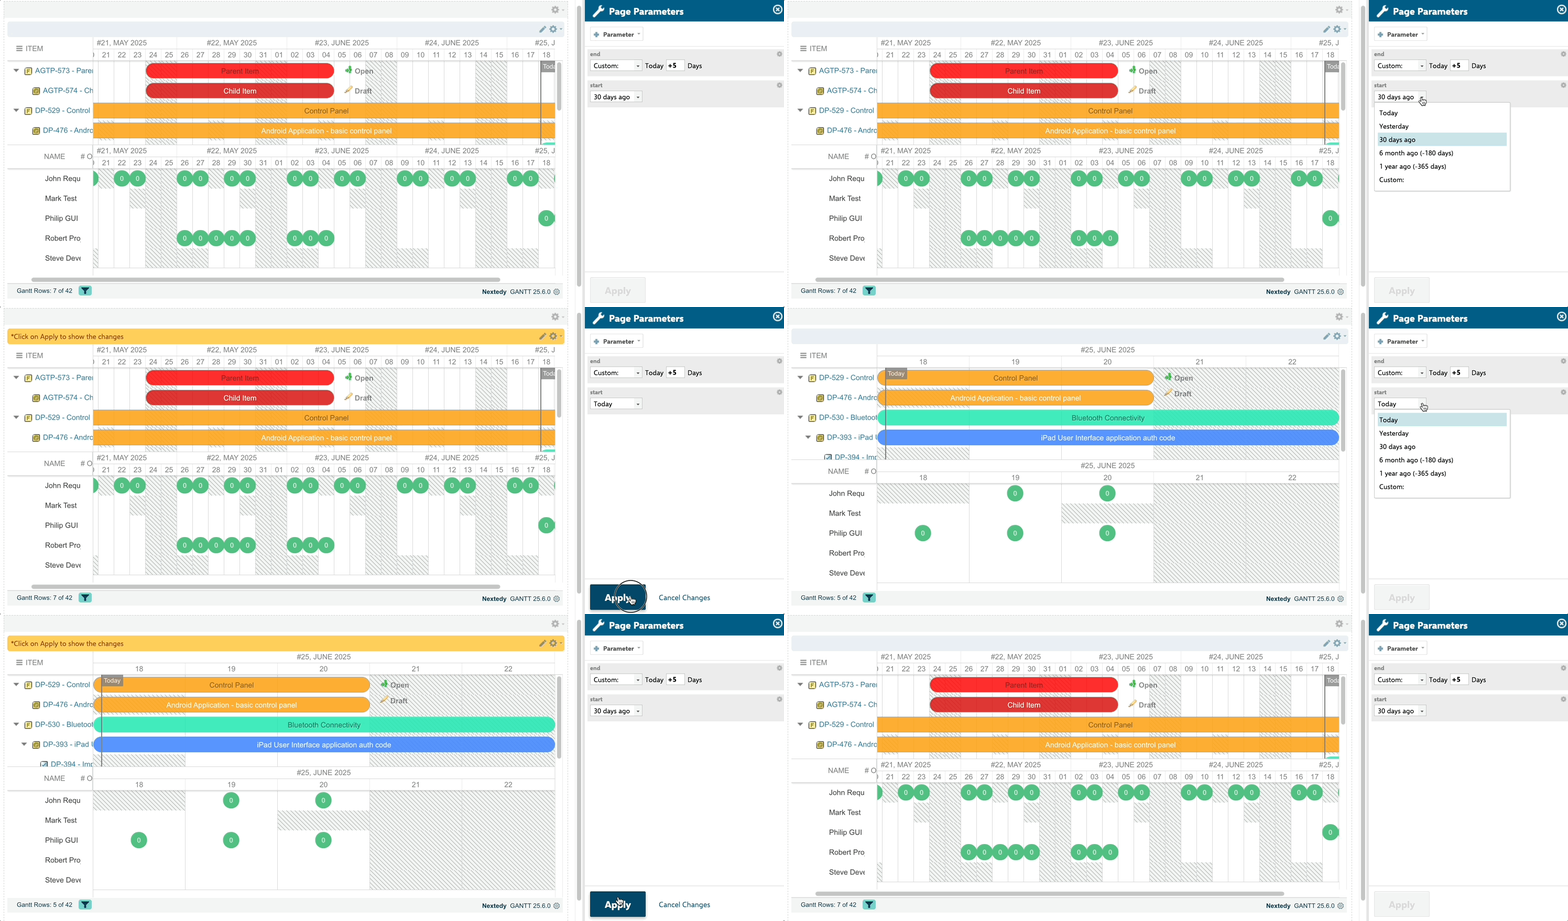
To let users select the time range interactively, create `start` and `end` page parameters on your LiveReport page, then reference them in the Gantt Config Script:
## Filter by Time Range
Set a fixed time range in **Advanced > Gantt Config Script** to limit which work items are visible on the chart:
```javascript theme={null}
gantt.config.start_date = new Date(2024, 11, 10);
gantt.config.end_date = new Date(2025, 7, 20);
```
In JavaScript `Date` objects, months start at 0 (January = 0, December = 11). The example above sets the range from **10 December 2024** to **20 August 2025**.
### Use Page Parameters for Dynamic Time Ranges
To let users select the time range interactively, create `start` and `end` page parameters on your LiveReport page, then reference them in the Gantt Config Script:
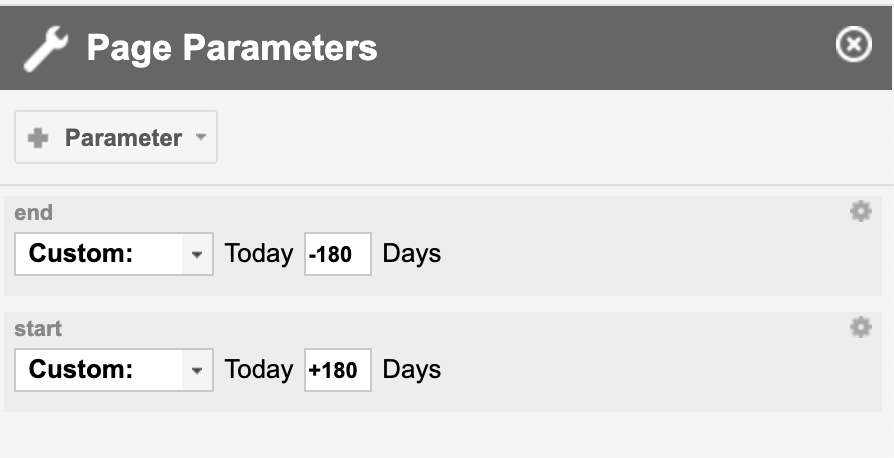 ```javascript theme={null}
gantt.config.start_date = new Date($widgetContext.pageParameters.start.value.time);
gantt.config.end_date = new Date($widgetContext.pageParameters.end.value.time);
```
Replace `start` and `end` with the IDs of your page parameters if you named them differently. See [Use Dynamic Queries with Page Parameters](/gantt/guides/filtering/dynamic-queries) for more details.
```javascript theme={null}
gantt.config.start_date = new Date($widgetContext.pageParameters.start.value.time);
gantt.config.end_date = new Date($widgetContext.pageParameters.end.value.time);
```
Replace `start` and `end` with the IDs of your page parameters if you named them differently. See [Use Dynamic Queries with Page Parameters](/gantt/guides/filtering/dynamic-queries) for more details.
 ## Filter by Item
1. Click one or more work items in the Gantt chart to select them.
2. Click the **Filter by Item** button in the toolbar.
3. The chart displays only the selected items and their related items (parents, children, and dependencies).
## Filter by Item
1. Click one or more work items in the Gantt chart to select them.
2. Click the **Filter by Item** button in the toolbar.
3. The chart displays only the selected items and their related items (parents, children, and dependencies).
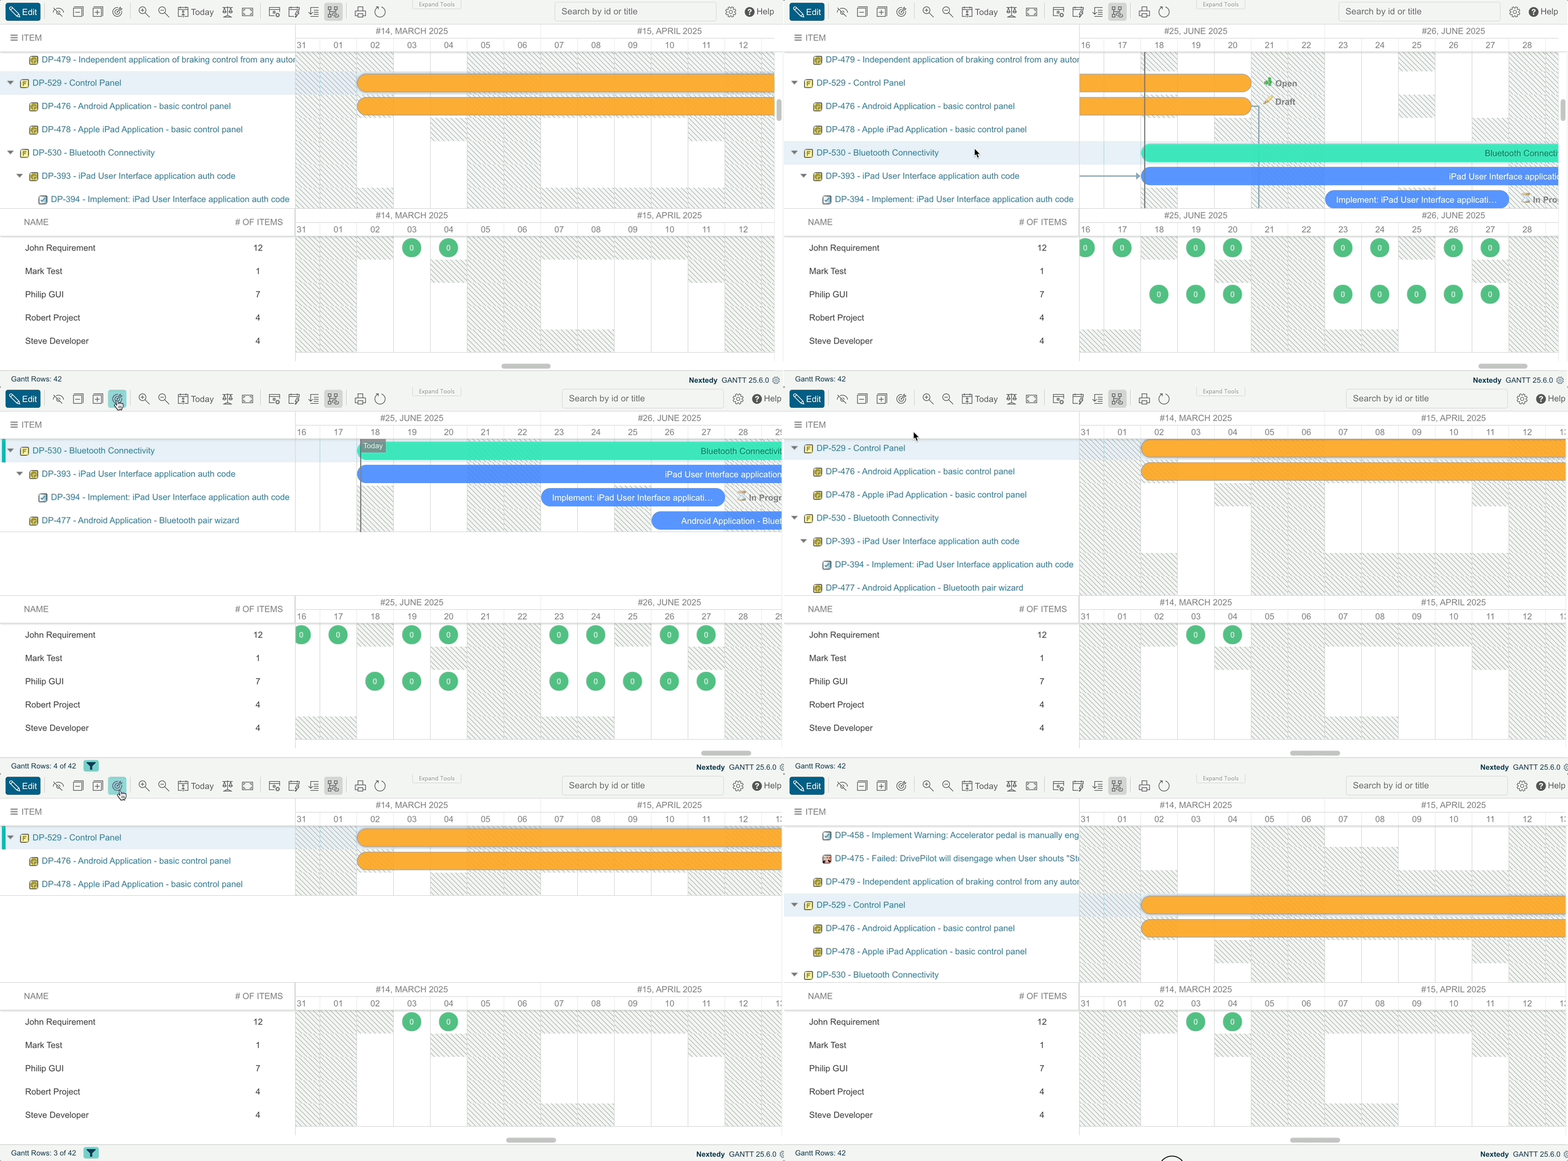 To clear the filter, click the **Filter by Item** toolbar button again to toggle it off.
## Filter by Resource
Click on a specific resource (assignee) name in the resource view to filter the chart to only rows where that resource is assigned. This helps you focus on an individual team member's workload.
To clear the filter, click the **Filter by Item** toolbar button again to toggle it off.
## Filter by Resource
Click on a specific resource (assignee) name in the resource view to filter the chart to only rows where that resource is assigned. This helps you focus on an individual team member's workload.
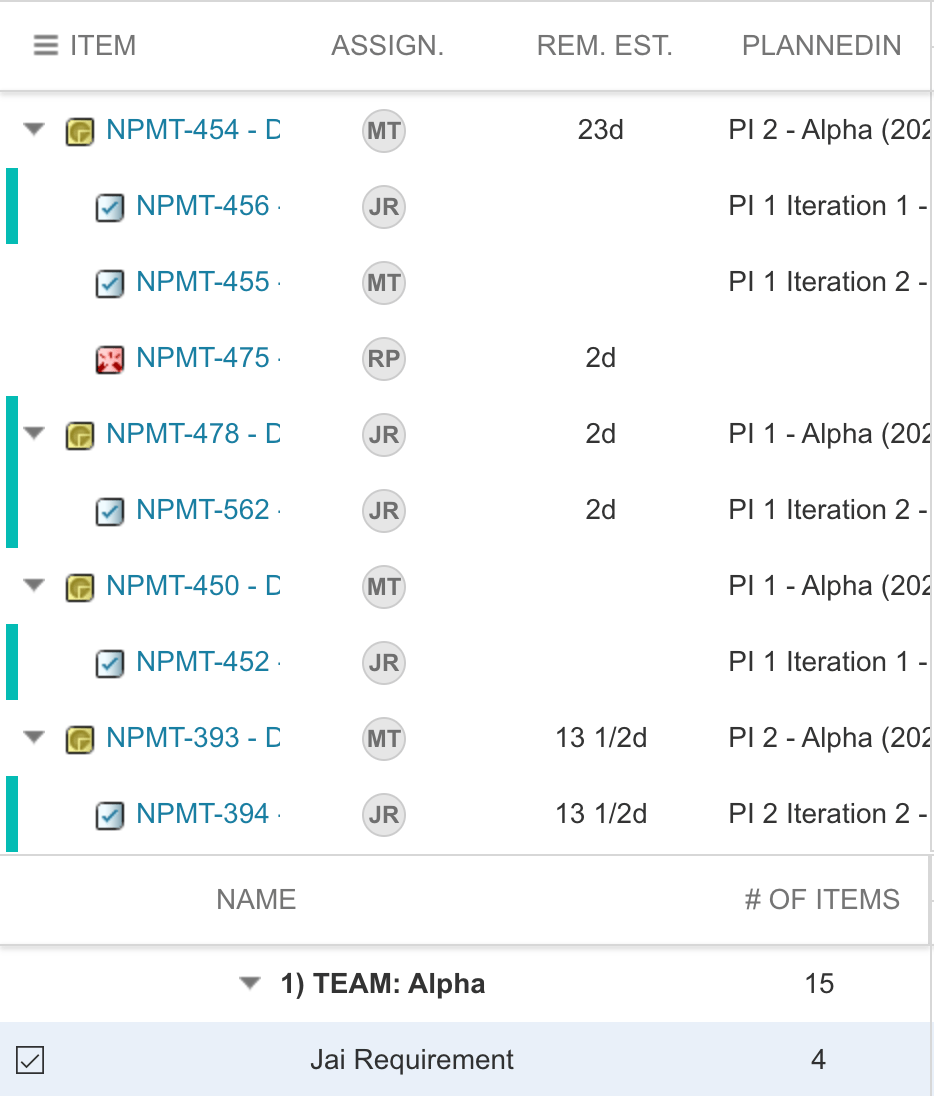
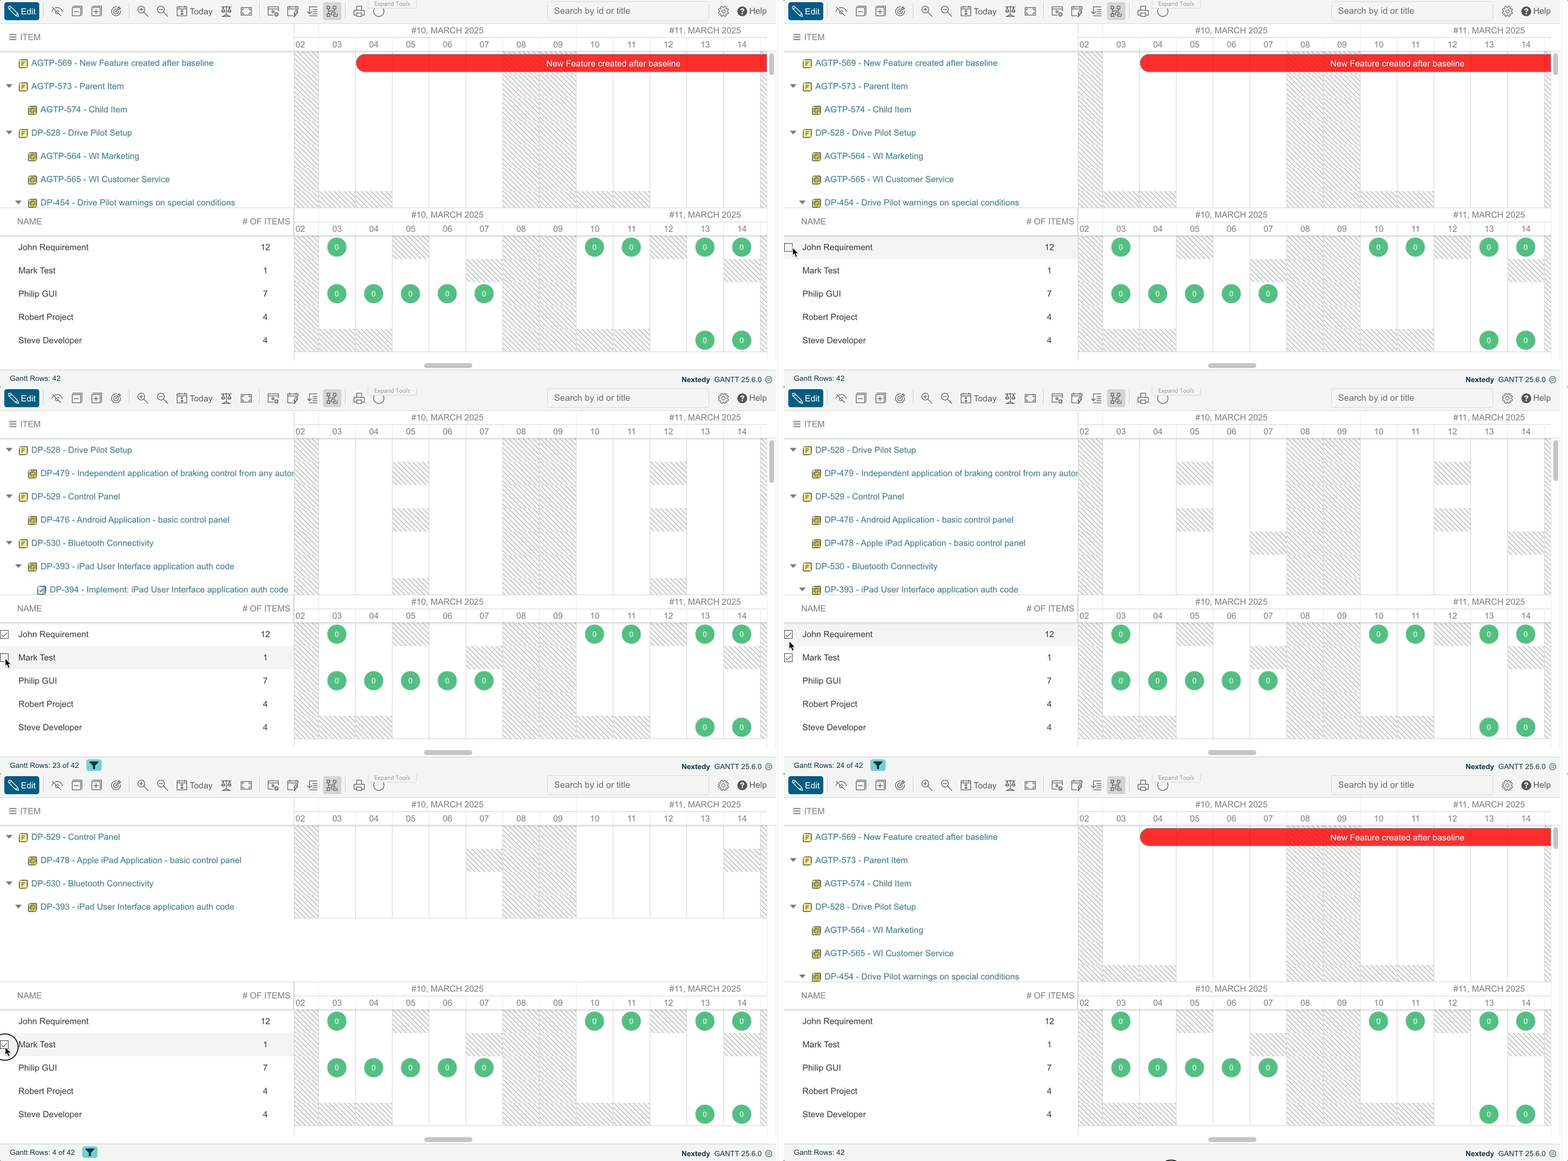 When filtering by resource, parent and dependent tasks remain visible to maintain the scheduling context. The filtered resource's tasks are highlighted while related items stay accessible.
 ## Filter by Allocation Bubble
Click an allocation bubble (marker cell) in the resource view to filter by a specific resource within a specific time period. This shows which work items contribute to that resource's workload in the selected day, week, or month.
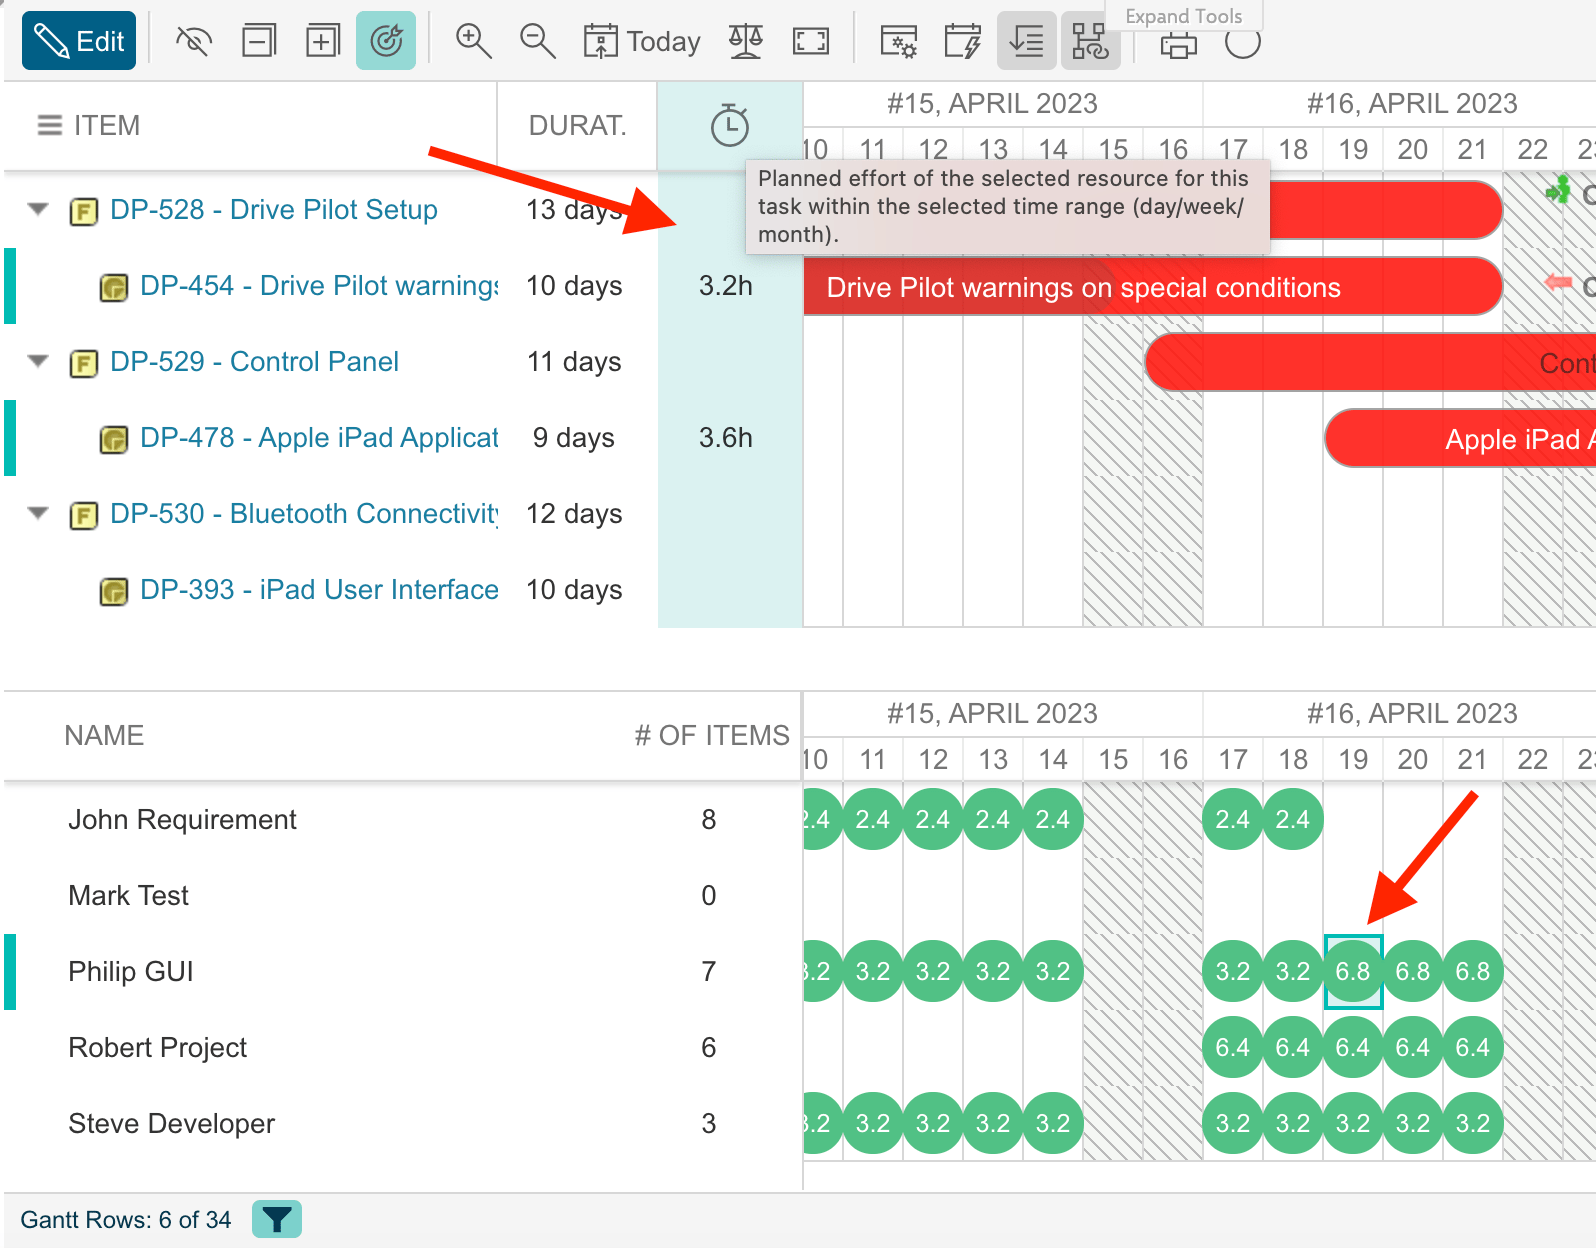
When the **Resource Load Calculation** is set to **Remaining Estimate** or **Estimate + Spent**, a workload column appears in the table view showing the planned effort (in hours) per task. Since version 25.4.2, filtering by allocation bubble works with all load calculation modes, but the per-task effort column only appears for estimate-based modes.
## Filter by Allocation Bubble
Click an allocation bubble (marker cell) in the resource view to filter by a specific resource within a specific time period. This shows which work items contribute to that resource's workload in the selected day, week, or month.
When the **Resource Load Calculation** is set to **Remaining Estimate** or **Estimate + Spent**, a workload column appears in the table view showing the planned effort (in hours) per task. Since version 25.4.2, filtering by allocation bubble works with all load calculation modes, but the per-task effort column only appears for estimate-based modes.
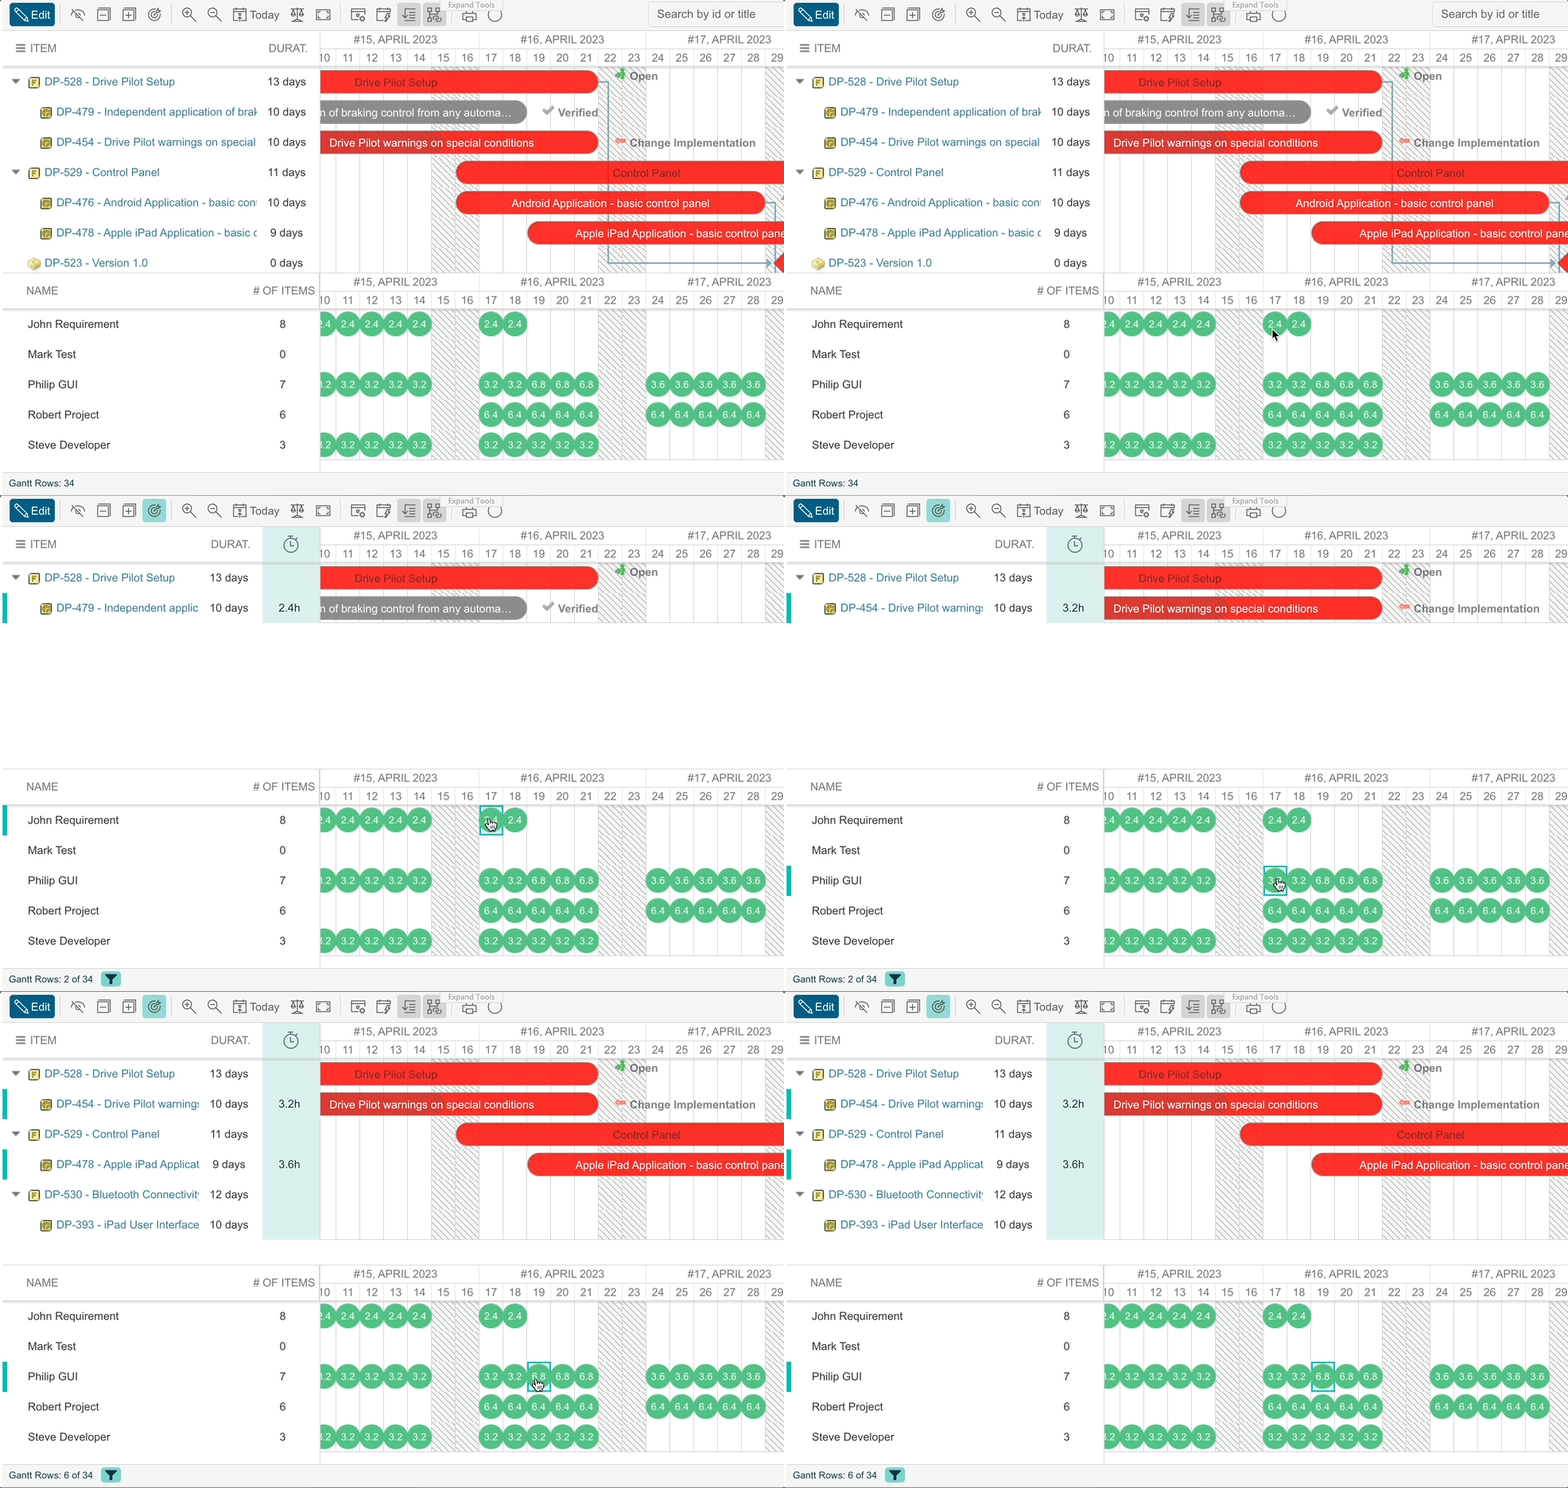 When you filter by allocation bubble, any collapsed parent items automatically expand so you can see all affected items and their allocations.
 ## Footer Indicators
The Gantt footer shows the number of visible rows versus the total (for example, "Gantt Rows: 4 of 10"). When items are hidden by a filter or by collapsed parent rows, the funnel icon appears. Hover over it to see which filter is active and why items are hidden.
## Verification
After applying a filter, you should now see:
* The funnel icon in the footer indicating an active filter.
* Only the matching work items visible in the chart.
* The footer row count reflecting the filtered set (for example, "Gantt Rows: 4 of 10").
* Hovering over the funnel icon displays a tooltip describing the active filter.
## See Also
* [Filter by Resource and Allocation](/gantt/guides/filtering/filter-by-resource)
* [Set the Gantt Time Range](/gantt/guides/scheduling/set-time-range)
* [Use Dynamic Queries with Page Parameters](/gantt/guides/filtering/dynamic-queries)
* [Configure the Toolbar and Menus](/gantt/guides/layout/toolbar-configuration)
* [Set Up the Resource View](/gantt/guides/resources/resource-view)
## Footer Indicators
The Gantt footer shows the number of visible rows versus the total (for example, "Gantt Rows: 4 of 10"). When items are hidden by a filter or by collapsed parent rows, the funnel icon appears. Hover over it to see which filter is active and why items are hidden.
## Verification
After applying a filter, you should now see:
* The funnel icon in the footer indicating an active filter.
* Only the matching work items visible in the chart.
* The footer row count reflecting the filtered set (for example, "Gantt Rows: 4 of 10").
* Hovering over the funnel icon displays a tooltip describing the active filter.
## See Also
* [Filter by Resource and Allocation](/gantt/guides/filtering/filter-by-resource)
* [Set the Gantt Time Range](/gantt/guides/scheduling/set-time-range)
* [Use Dynamic Queries with Page Parameters](/gantt/guides/filtering/dynamic-queries)
* [Configure the Toolbar and Menus](/gantt/guides/layout/toolbar-configuration)
* [Set Up the Resource View](/gantt/guides/resources/resource-view)