> ## Documentation Index
> Fetch the complete documentation index at: https://learn.nextedy.com/llms.txt
> Use this file to discover all available pages before exploring further.
# Set Up a Plans Gantt Chart
> This tutorial guides you through creating a Plans Nextedy GANTT chart that displays Polarion Plans as first-class Gantt items.
export const LastReviewed = ({date}) => {
if (!date) return null;
const formatted = new Date(`${date}T00:00:00Z`).toLocaleDateString("en-US", {
year: "numeric",
month: "long",
day: "numeric",
timeZone: "UTC"
});
return
Last reviewed on {formatted}
;
};
## What You Will Achieve
After completing this tutorial, you will have:
* A Plans Gantt widget showing Polarion Plans as top-level task bars
* Nested sub-plans displayed beneath parent plans
* Work items shown within their parent plans
* A multi-level Gantt view suitable for release and iteration planning
## Prerequisites
* [Gantt installed](/gantt/getting-started/installation) on your Polarion server
* A Polarion project with existing Plans (releases, iterations, or sprints)
* Edit permissions on the project's Documents & Pages
The Plans Gantt widget uses a different data model than the Work Items Gantt. Plans are Polarion's built-in planning containers (releases, iterations, sprints). If you need to schedule individual tasks, use the [Work Items Gantt](/gantt/getting-started/setup-basic-gantt) instead.
1. Open your Polarion project
2. Navigate to **Documents & Pages**
3. Select a space (for example, **Default Space**)
4. Click **Expand Tools**, then the **Gear** button, and select **Create New**
5. Choose **Info/LiveReport Page** and enter a title (for example, "Release Roadmap")
6. Click **Create**
You should see an empty page ready for widget configuration.
In the widget picker on the right side of the page:
1. Expand the **Plans** category
2. Select **Gantt (Plans)**
3. The widget loads, displaying plans from your project
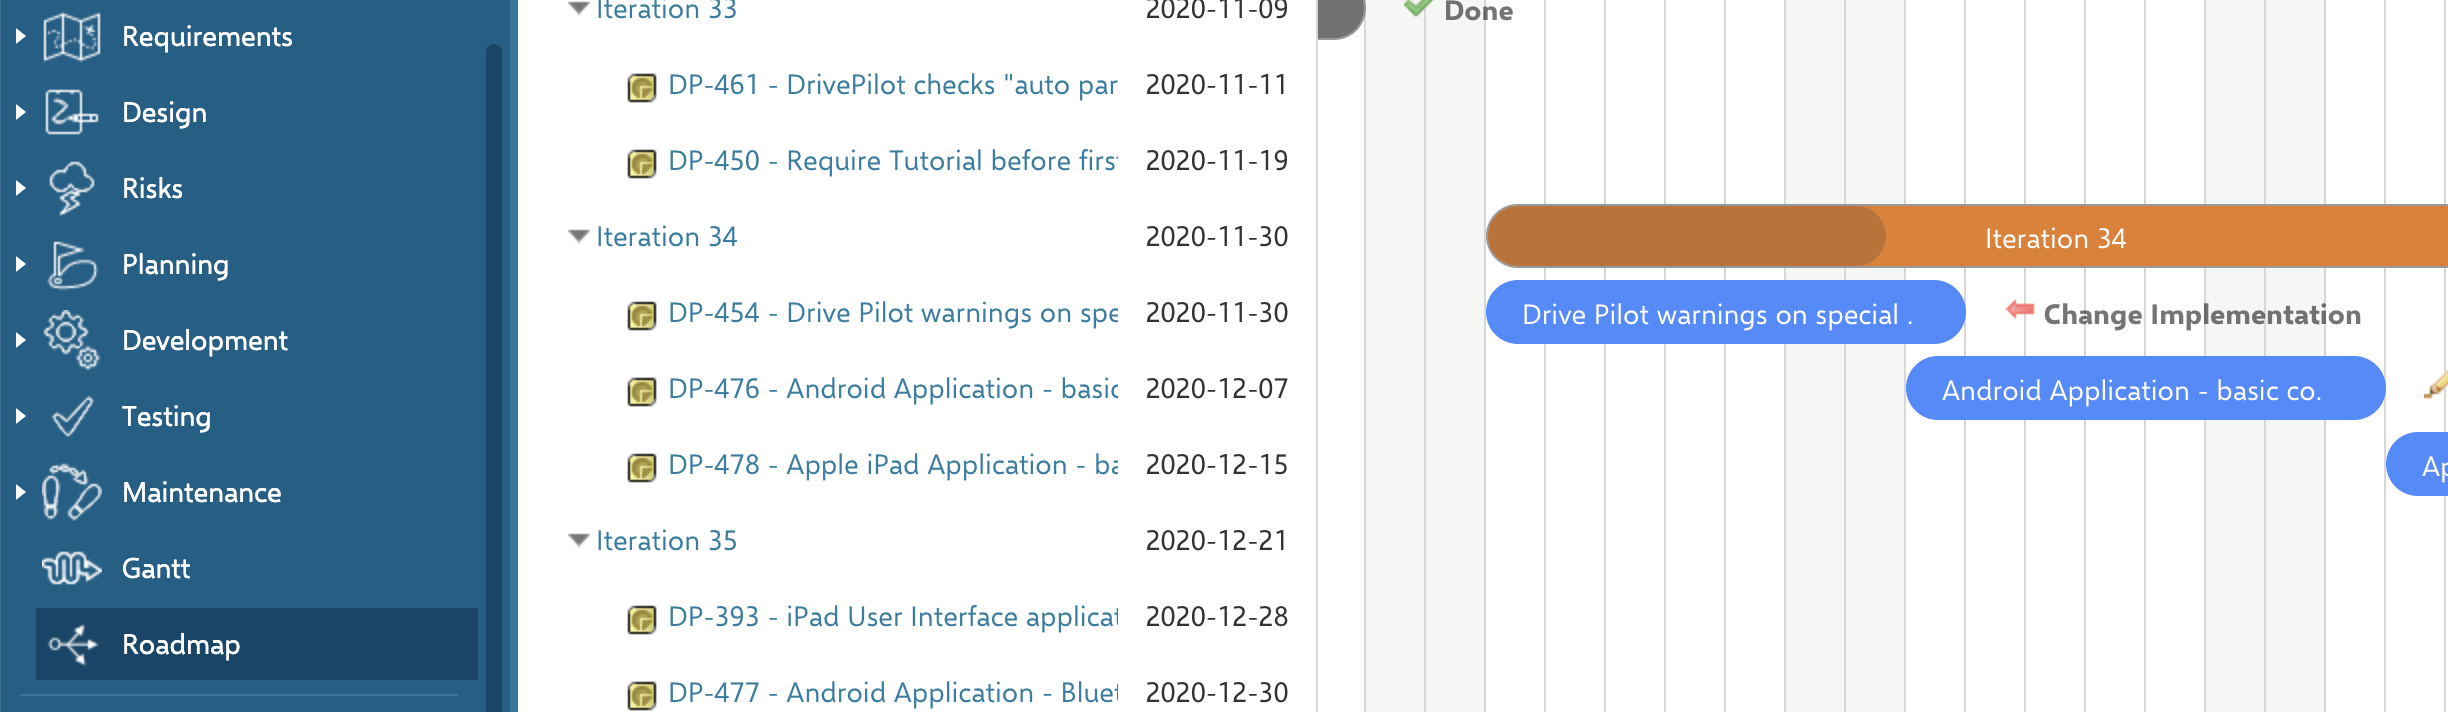 The Plans Gantt widget appears under a different category than the Work Items Gantt. Make sure you select **Gantt (Plans)** from the **Plans** section.
1. Open the widget parameters
2. In the **Plans** data set section, configure the scope to show plans with a specific template (for example, **Release**)
3. Click **Apply**
The Plans Gantt widget appears under a different category than the Work Items Gantt. Make sure you select **Gantt (Plans)** from the **Plans** section.
1. Open the widget parameters
2. In the **Plans** data set section, configure the scope to show plans with a specific template (for example, **Release**)
3. Click **Apply**
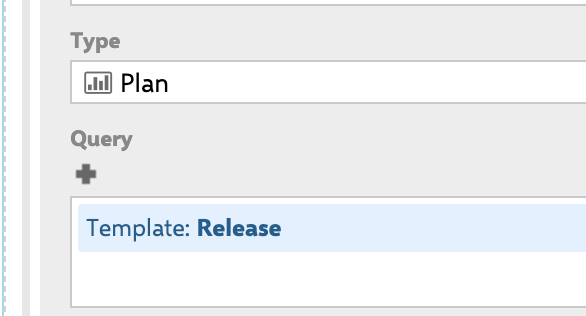 You should see only plans matching the selected template displayed as task bars on the Gantt chart.
To display child plans (for example, iterations beneath releases):
1. In the widget parameters, set **Load Children** to `2` to load two levels of plan hierarchy
2. Click **Apply**
You should see only plans matching the selected template displayed as task bars on the Gantt chart.
To display child plans (for example, iterations beneath releases):
1. In the widget parameters, set **Load Children** to `2` to load two levels of plan hierarchy
2. Click **Apply**
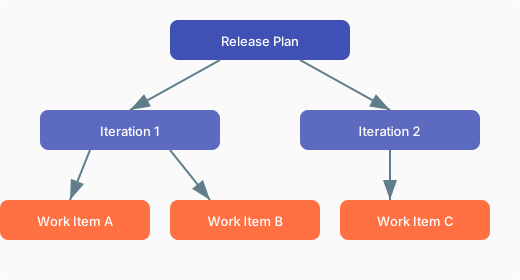
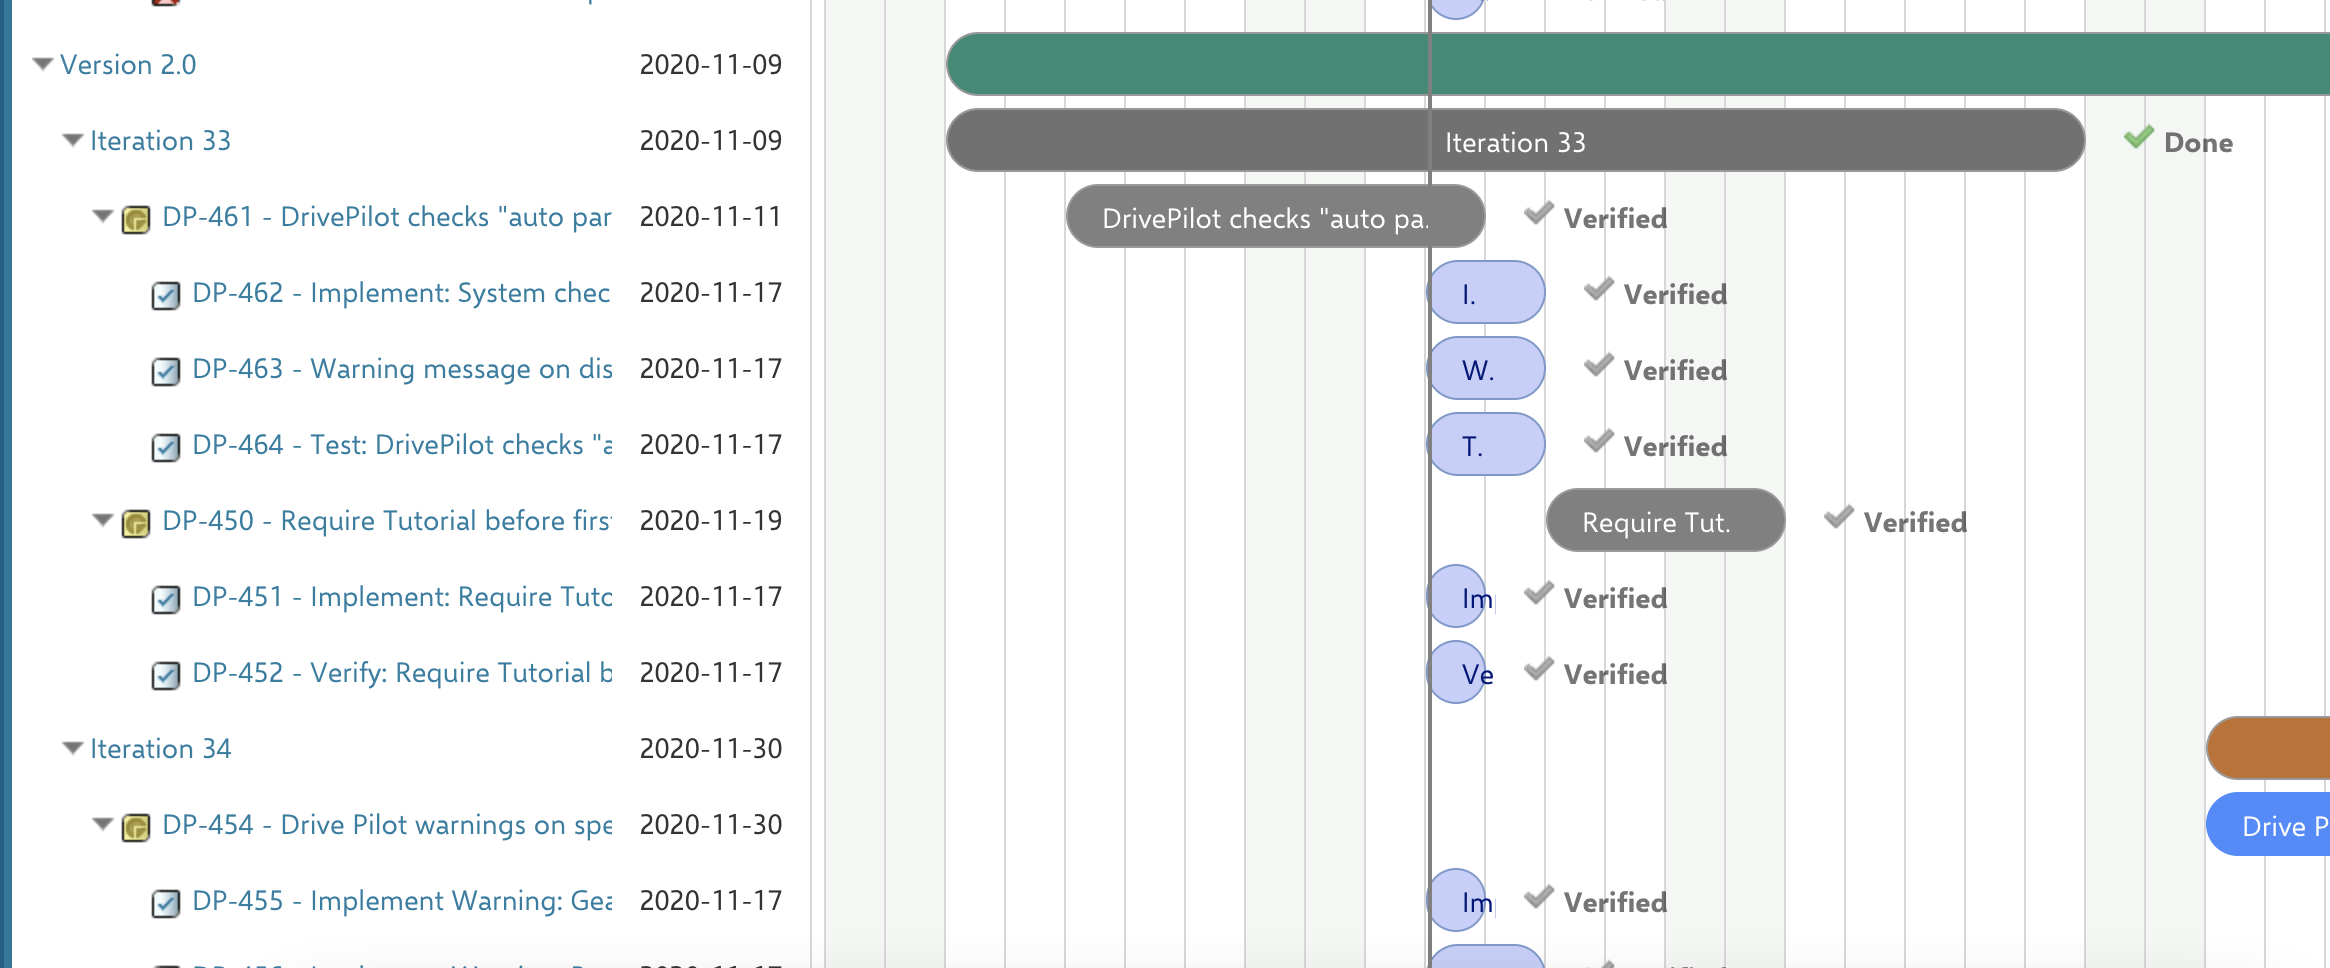
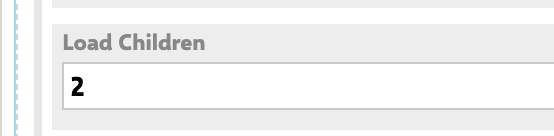 You should see a hierarchy like:
| Level | Example |
| ----- | --------------------------- |
| 0 | Release (e.g., Version 2.0) |
| 1 | Iteration (e.g., Sprint 35) |
| 2 | Work Items (if enabled) |
You should see a hierarchy like:
| Level | Example |
| ----- | --------------------------- |
| 0 | Release (e.g., Version 2.0) |
| 1 | Iteration (e.g., Sprint 35) |
| 2 | Work Items (if enabled) |
 To display the actual work items contained in each plan:
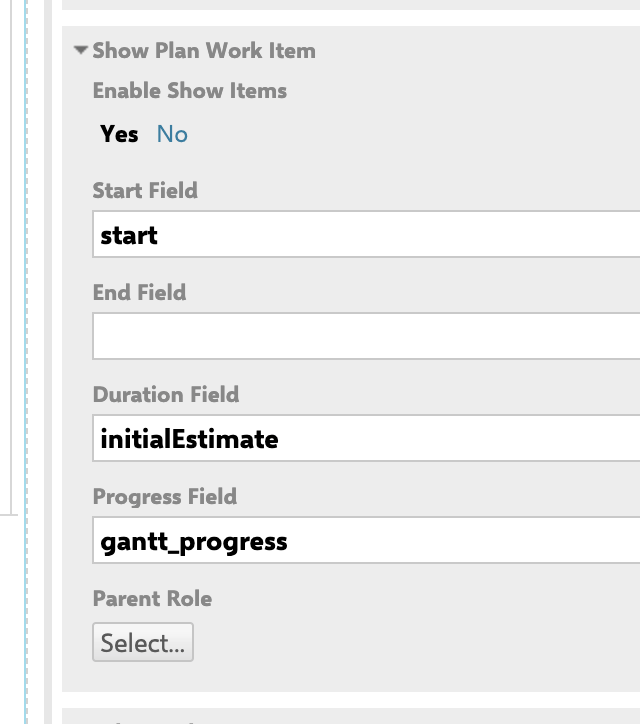
1. In the widget parameters, find the **Show Plan Work Item** section
2. Set **Enable Show Items** to **Yes**
3. Configure the field mappings for the work items:
* **Start Field**: the work item field holding the start date
* **End Field**: the work item field holding the end date
* **Duration Field**: the work item field holding duration
To display the actual work items contained in each plan:
1. In the widget parameters, find the **Show Plan Work Item** section
2. Set **Enable Show Items** to **Yes**
3. Configure the field mappings for the work items:
* **Start Field**: the work item field holding the start date
* **End Field**: the work item field holding the end date
* **Duration Field**: the work item field holding duration
 4. Set the **Parent Role** to define how work item hierarchy is resolved within plans
5. Click **Apply**
4. Set the **Parent Role** to define how work item hierarchy is resolved within plans
5. Click **Apply**
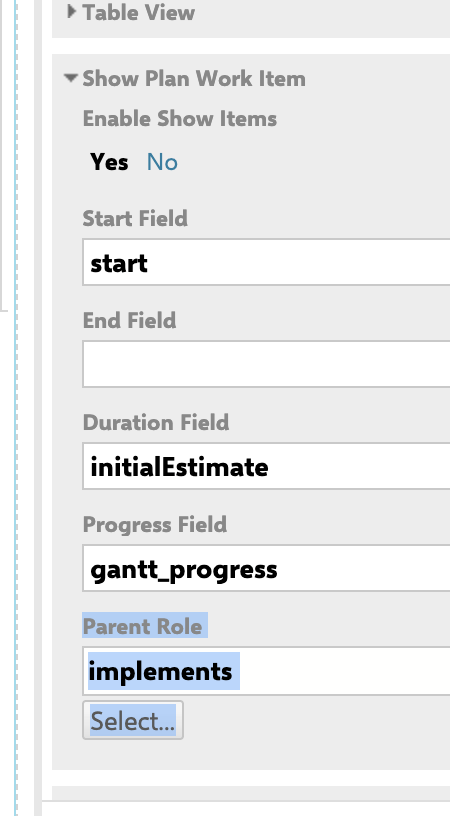 You should now see work items displayed as task bars beneath their parent plan bars.
 Plans Gantt charts typically use longer time scales. Set the **Scale** parameter to `W` (week) or `M` (month) for a better overview of release timelines.
If your work items have dependency relationships with work items:
1. In the **Show Plan Work Item** section, find **Dependency Role**
2. Select the link role used for dependencies (for example, `depends_on`)
3. Click **Apply**
Dependency arrows now appear between work items within the Plans Gantt view.
Fine-tune the Plans Gantt view:
1. Set **Sort by** to control the order of plans (default is `id`)
2. Set **Show Unplanned** to **Yes** if you want to see plans without dates (they appear at today's date in gray)
3. Enable **Maximize View** in the Advanced section for full-page display
4. Click **Apply** and save the page
Work item creation from within Plans Gantt may be limited to the lowest plan level. If you need to create work items at multiple plan levels, consider using separate Gantt widgets for each level.
## Plans Gantt Parameter Summary
| Parameter | Purpose | Default |
| ----------------------- | ------------------------------- | ------------- |
| **Plans Data Set** | Which plans to display | Project scope |
| **Load Children** | Depth of sub-plan loading | `0` |
| **Show Plan Work Item** | Display work items within plans | Disabled |
| **Sort by** | Plan sort order | `id` |
| **Show Unplanned** | Show undated plans | Disabled |
| **Scale** | Timeline scale | `W` (week) |
## Next Steps
* [Set Up a Basic Gantt Chart](/gantt/getting-started/setup-basic-gantt) -- learn the Work Items Gantt for task-level scheduling
* [Create Your First Dependency Link](/gantt/getting-started/first-dependency) -- connect tasks with dependency arrows
* [View Resource Allocation](/gantt/getting-started/first-resource-view) -- monitor team workload across plans
Plans Gantt charts typically use longer time scales. Set the **Scale** parameter to `W` (week) or `M` (month) for a better overview of release timelines.
If your work items have dependency relationships with work items:
1. In the **Show Plan Work Item** section, find **Dependency Role**
2. Select the link role used for dependencies (for example, `depends_on`)
3. Click **Apply**
Dependency arrows now appear between work items within the Plans Gantt view.
Fine-tune the Plans Gantt view:
1. Set **Sort by** to control the order of plans (default is `id`)
2. Set **Show Unplanned** to **Yes** if you want to see plans without dates (they appear at today's date in gray)
3. Enable **Maximize View** in the Advanced section for full-page display
4. Click **Apply** and save the page
Work item creation from within Plans Gantt may be limited to the lowest plan level. If you need to create work items at multiple plan levels, consider using separate Gantt widgets for each level.
## Plans Gantt Parameter Summary
| Parameter | Purpose | Default |
| ----------------------- | ------------------------------- | ------------- |
| **Plans Data Set** | Which plans to display | Project scope |
| **Load Children** | Depth of sub-plan loading | `0` |
| **Show Plan Work Item** | Display work items within plans | Disabled |
| **Sort by** | Plan sort order | `id` |
| **Show Unplanned** | Show undated plans | Disabled |
| **Scale** | Timeline scale | `W` (week) |
## Next Steps
* [Set Up a Basic Gantt Chart](/gantt/getting-started/setup-basic-gantt) -- learn the Work Items Gantt for task-level scheduling
* [Create Your First Dependency Link](/gantt/getting-started/first-dependency) -- connect tasks with dependency arrows
* [View Resource Allocation](/gantt/getting-started/first-resource-view) -- monitor team workload across plans