> ## Documentation Index
> Fetch the complete documentation index at: https://learn.nextedy.com/llms.txt
> Use this file to discover all available pages before exploring further.
# View Resource Allocation
> This tutorial walks you through enabling and exploring the resource view in your Nextedy GANTT chart.
export const LastReviewed = ({date}) => {
if (!date) return null;
const formatted = new Date(`${date}T00:00:00Z`).toLocaleDateString("en-US", {
year: "numeric",
month: "long",
day: "numeric",
timeZone: "UTC"
});
return
Last reviewed on {formatted}
;
};
## What You Will Achieve
After completing this tutorial, you will have:
* The resource view enabled below your Gantt chart
* Resource allocation markers displaying workload per team member
* An understanding of load calculation modes and overallocation indicators
## Prerequisites
* [Gantt installed](/gantt/getting-started/installation) on your Polarion server
* A working Gantt chart with work items assigned to users (see [Set Up a Basic Gantt Chart](/gantt/getting-started/setup-basic-gantt))
* Edit permissions on the Gantt page
1. Enter page edit mode by clicking **Edit** on the Polarion page
2. Open the widget parameters by clicking the widget gear icon
3. Scroll to the **Resource View** section
4. Set **Show Resource View** to **Yes**
Additional parameters appear after enabling the resource view:
| Parameter | Purpose | Default |
| ----------------------------- | --------------------------------------------------- | ---------------- |
| **Items per resource** | Over-allocation threshold for leaf items count mode | 1 |
| **View Height** | Default height of the resource panel in pixels | 250 |
| **Resource Field** | Which work item field identifies the resource | `assignee` |
| **Resource Label** | Column header text for resources | Name |
| **Show Unassigned** | Display a row for unassigned work items | No |
| **Resource Load Calculation** | How workload is computed | Leaf Items Count |
5. Click **Apply**
You should see a new panel appear below the Gantt chart showing one row per resource (team member), with colored markers indicating workload for each time period.
The resource view displays:
* **Resource rows**: one row per team member (or per value of the configured resource field)
* **Item count**: the number of work items assigned to each resource
* **Workload cells**: colored cells aligned with the timeline, showing allocation per time period
* **Color indicators**: green cells indicate allocation within capacity, red cells indicate overallocation
You can resize the resource view by dragging the horizontal divider line between the Gantt chart and the resource panel. The **View Height** parameter sets the initial height.
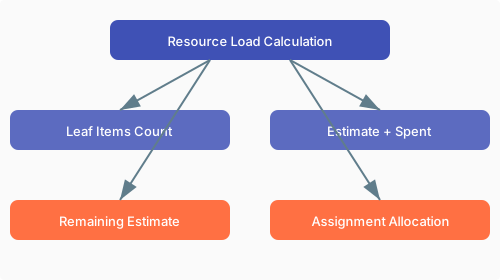
The resource view supports four load calculation modes, each suited to different planning needs:
 ### Leaf Items Count
Counts how many leaf-level work items (items with no children) are assigned to each resource per time period. Each item counts as one unit regardless of estimated effort. The cell turns red when the count exceeds the **Items per resource** threshold.
### Estimate + Spent
Sums the remaining estimate and time already spent on each item. This total effort is distributed evenly across the task's scheduled days, providing a comprehensive workload view that accounts for both completed and pending work.
### Remaining Estimate
Shows only the remaining effort required to complete each task. Past effort (time already spent) is excluded. Effort is distributed from today forward across the remaining scheduled days. This mode is useful for forecasting future workload.
### Assignment Allocation
Uses team-based assignment percentages to calculate workload. Each team member's allocation across teams and projects is summed. When total allocation exceeds 100%, the cell turns red to indicate overallocation. This mode requires team assignment configuration.
For simple task tracking, **Leaf Items Count** is the easiest starting point. For effort-based planning with time tracking, use **Estimate + Spent** or **Remaining Estimate**. For team capacity management, use **Assignment Allocation**.
By default, the resource view uses the `assignee` field to identify resources. You can change this to any custom field:
1. In the widget parameters, find **Resource Field**
2. Change it to a different field (for example, a custom team field or enum field)
3. Click **Apply**
The resource view reloads, showing rows based on the selected field's values instead of assignees.
To see work items that have no resource assigned:
1. In the widget parameters, set **Show Unassigned** to **Yes**
2. Click **Apply**
A new row labeled "Unassigned" appears in the resource view, collecting all work items with no value in the resource field. This helps you spot unallocated work during planning.
Click **Apply** to confirm the widget parameters, then save the Polarion page.
## Reading the Resource View
| Visual Indicator | Meaning |
| ---------------- | -------------------------------------------------------------- |
| Green cell | Allocation within capacity |
| Red cell | Overallocation detected |
| Number in cell | Workload value (items, hours, or percentage depending on mode) |
| Tooltip on hover | Details about which work items contribute to the load |
Work items that are filtered out of the Gantt view may still affect resource calculations depending on configuration. If a parent work item has no visible children due to filtering, it may be counted as a leaf item in load calculations.
## Next Steps
* [Licensing and User Access](/gantt/getting-started/licensing) -- configure user groups for edit access
* [Update to the Latest Version](/gantt/getting-started/update-gantt) -- keep your Gantt installation current
* Explore [Guides](/gantt/guides/index) for advanced resource configuration, cross-team setup, and resource hiding
### Leaf Items Count
Counts how many leaf-level work items (items with no children) are assigned to each resource per time period. Each item counts as one unit regardless of estimated effort. The cell turns red when the count exceeds the **Items per resource** threshold.
### Estimate + Spent
Sums the remaining estimate and time already spent on each item. This total effort is distributed evenly across the task's scheduled days, providing a comprehensive workload view that accounts for both completed and pending work.
### Remaining Estimate
Shows only the remaining effort required to complete each task. Past effort (time already spent) is excluded. Effort is distributed from today forward across the remaining scheduled days. This mode is useful for forecasting future workload.
### Assignment Allocation
Uses team-based assignment percentages to calculate workload. Each team member's allocation across teams and projects is summed. When total allocation exceeds 100%, the cell turns red to indicate overallocation. This mode requires team assignment configuration.
For simple task tracking, **Leaf Items Count** is the easiest starting point. For effort-based planning with time tracking, use **Estimate + Spent** or **Remaining Estimate**. For team capacity management, use **Assignment Allocation**.
By default, the resource view uses the `assignee` field to identify resources. You can change this to any custom field:
1. In the widget parameters, find **Resource Field**
2. Change it to a different field (for example, a custom team field or enum field)
3. Click **Apply**
The resource view reloads, showing rows based on the selected field's values instead of assignees.
To see work items that have no resource assigned:
1. In the widget parameters, set **Show Unassigned** to **Yes**
2. Click **Apply**
A new row labeled "Unassigned" appears in the resource view, collecting all work items with no value in the resource field. This helps you spot unallocated work during planning.
Click **Apply** to confirm the widget parameters, then save the Polarion page.
## Reading the Resource View
| Visual Indicator | Meaning |
| ---------------- | -------------------------------------------------------------- |
| Green cell | Allocation within capacity |
| Red cell | Overallocation detected |
| Number in cell | Workload value (items, hours, or percentage depending on mode) |
| Tooltip on hover | Details about which work items contribute to the load |
Work items that are filtered out of the Gantt view may still affect resource calculations depending on configuration. If a parent work item has no visible children due to filtering, it may be counted as a leaf item in load calculations.
## Next Steps
* [Licensing and User Access](/gantt/getting-started/licensing) -- configure user groups for edit access
* [Update to the Latest Version](/gantt/getting-started/update-gantt) -- keep your Gantt installation current
* Explore [Guides](/gantt/guides/index) for advanced resource configuration, cross-team setup, and resource hiding